The Data-Driven Storytelling Process
Introduction
The process associated with data-driven storytelling incorporates a lot of the traditional work of journalism, but it adds a few unique steps. We can generalize that process into 7 to 10 steps, depending on how the journalist wants to start off and where they want to end up.
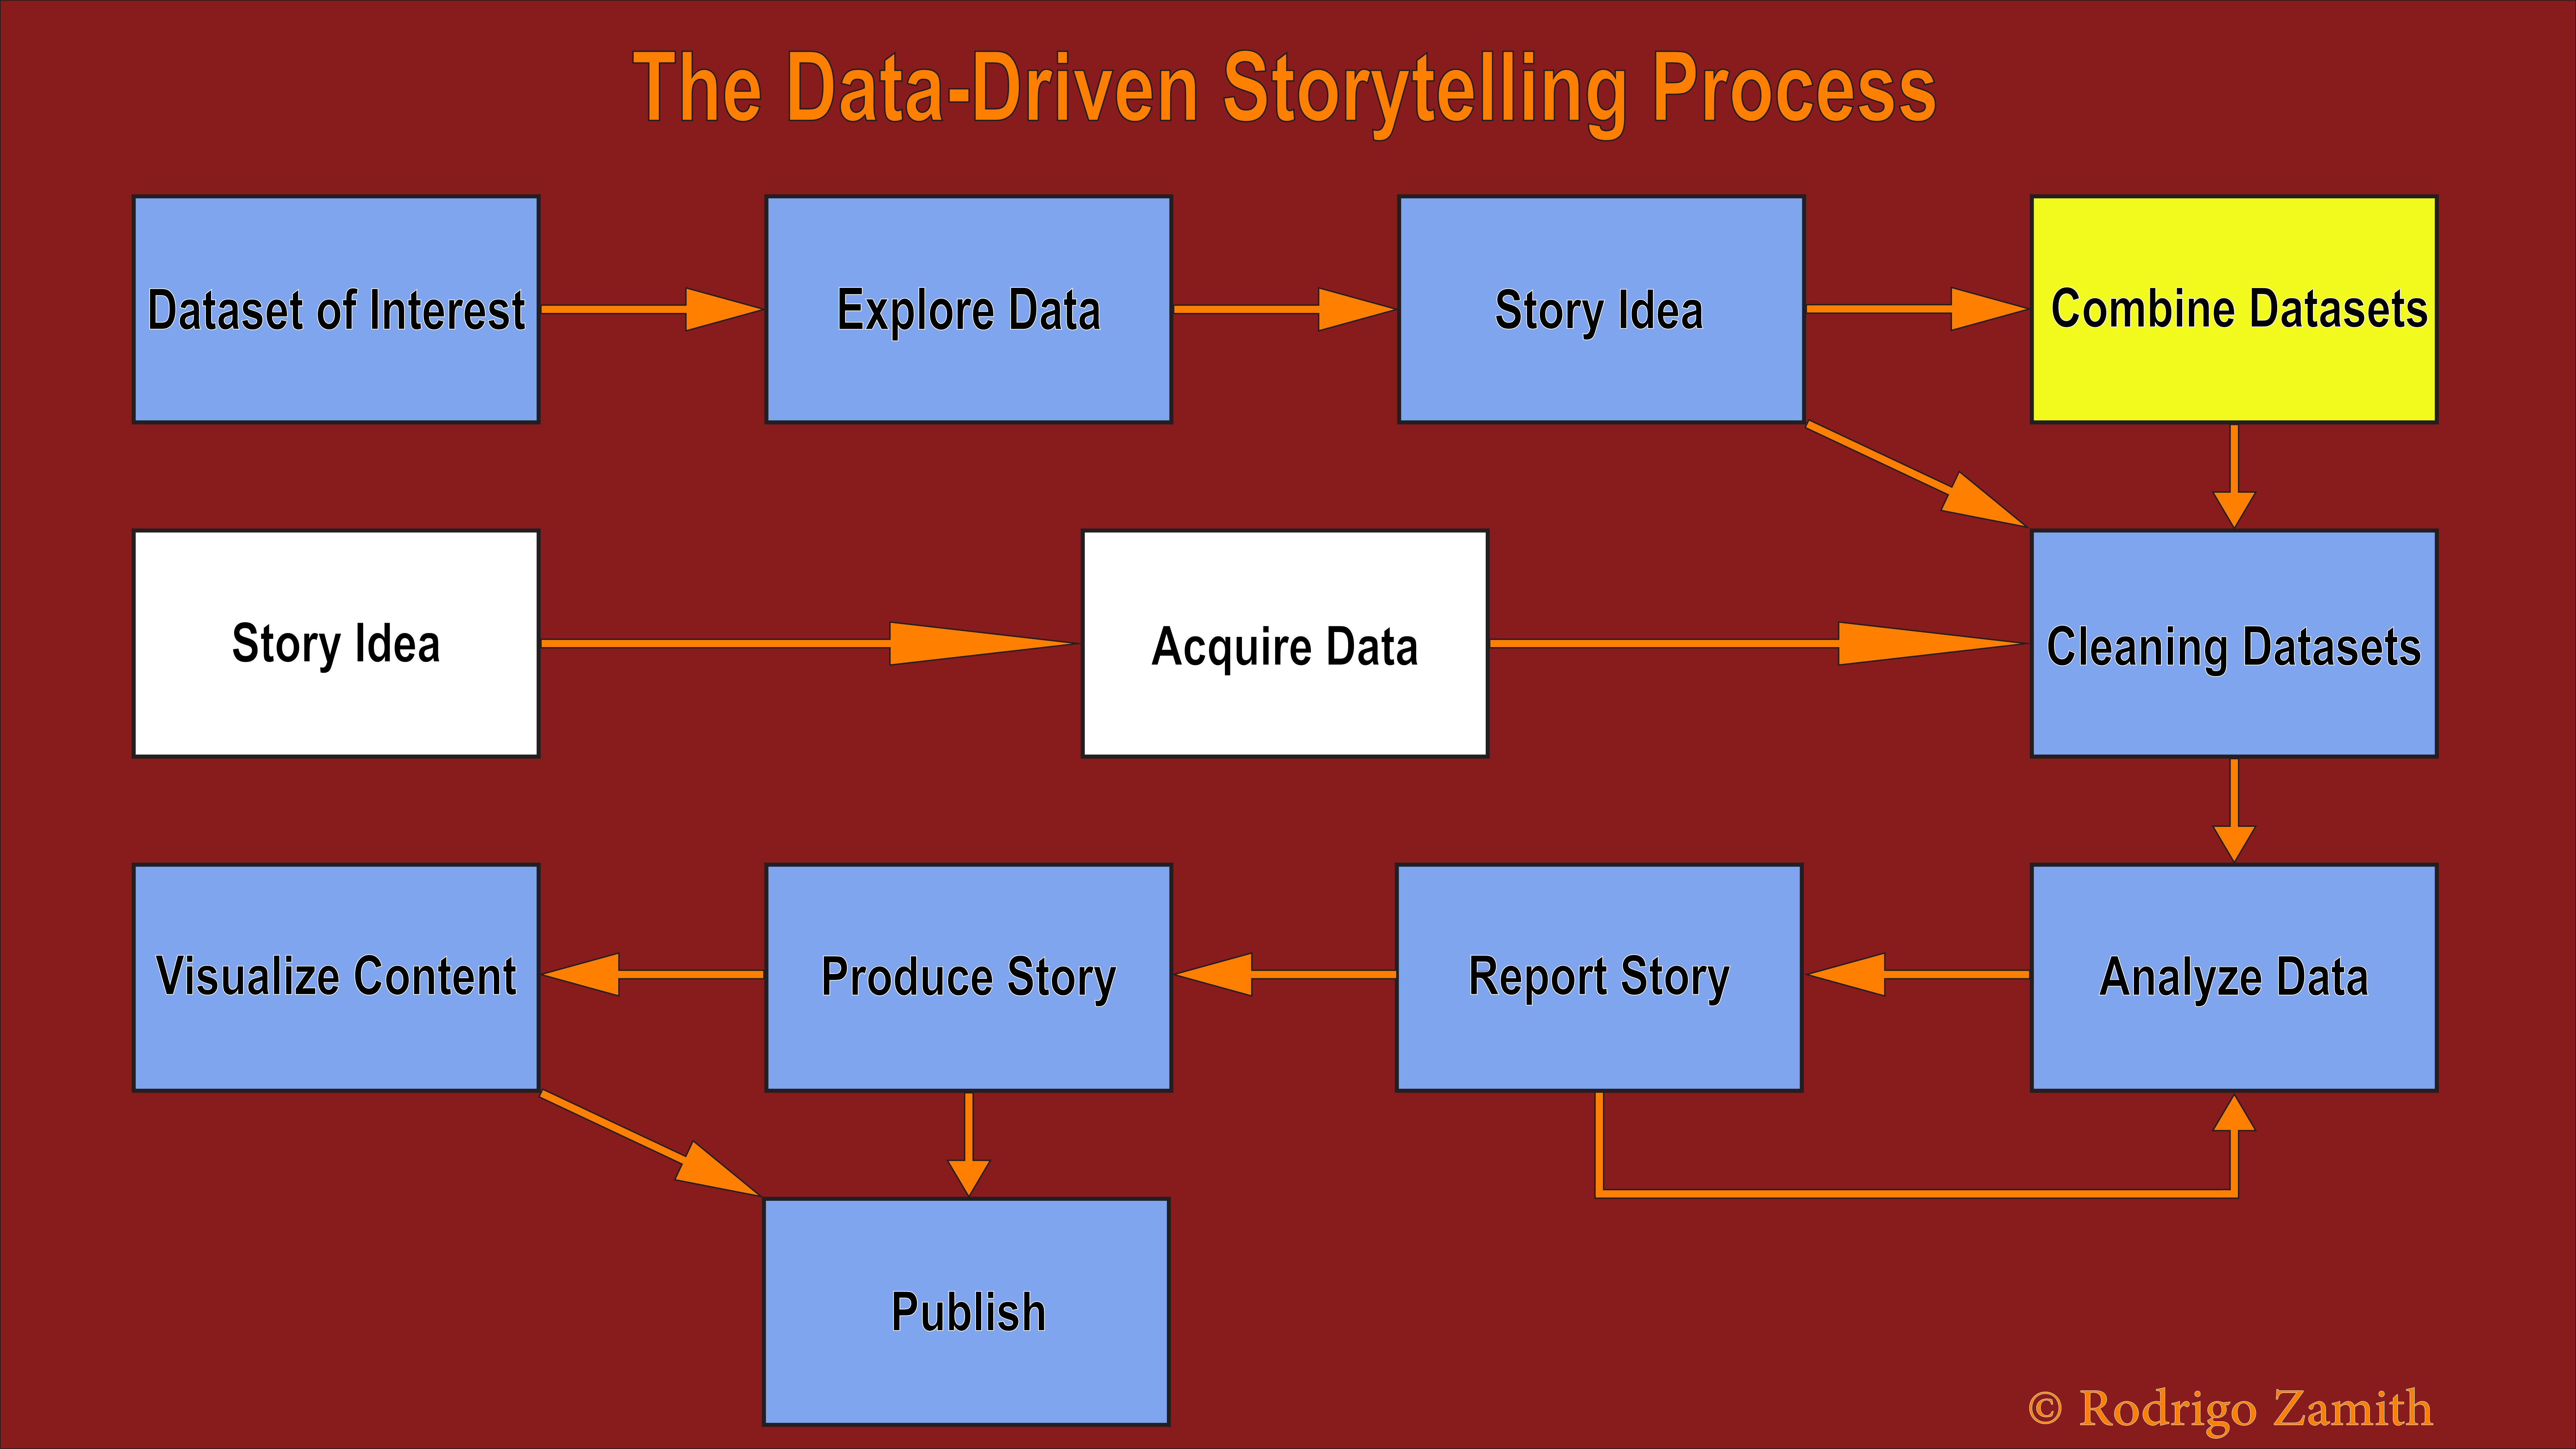
The process can begin either with an interesting dataset or with a story idea. Throughout this book, we will use the data as our starting point since you are likely new to the world of data-driven storytelling. However, in practice, the process often begins with the story idea, not the data.
Dataset of Interest
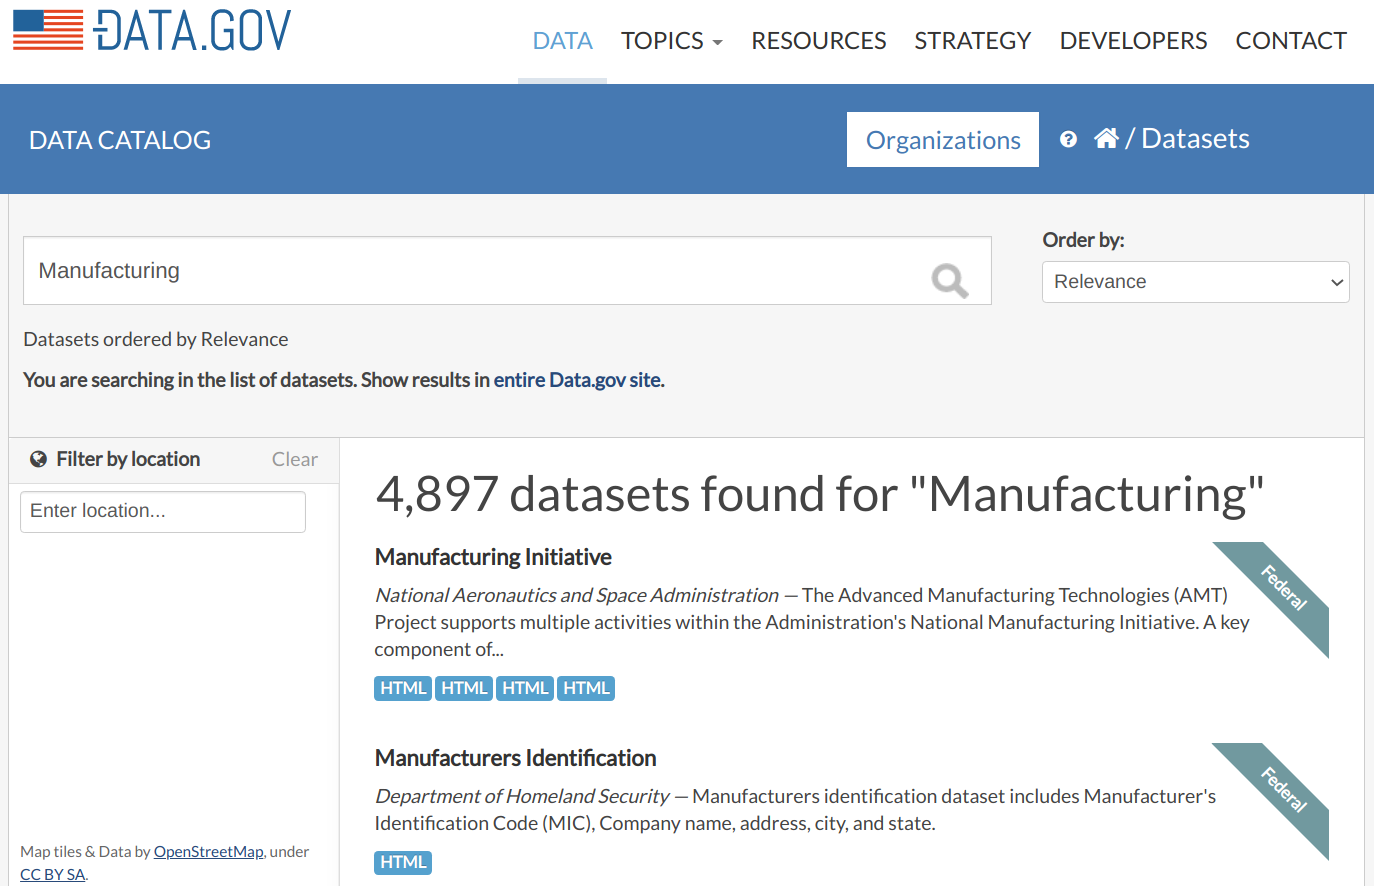
Journalists will sometimes begin their search for an interesting set of data by browsing data portals. One example of a data portal is the U.S. federal government’s Data.gov website, but there are many other portals that exist at other governmental levels (e.g., state government), that are topical (e.g., focus on economic information), or are produced by a large organization that collects a lot of data (e.g., the World Health Organization).
However, journalists will often also sign up for e-mail alerts from major producers of data, such as government agencies and NGOs, which tips them off to the release of a new dataset. Alternatively, journalists may just set up good filters and alerts on social media, or subscribe to e-mail lists where lovers of data congregate. Sometimes, the journalist may even be contacted directly by the producer of some dataset, as that person might be looking to draw more attention to the data they have painstakingly collected.
One other particularly common way to get relevant data is to file formal information requests for public data by using instruments like the Freedom of Information Act — though a journalist will often already have a semblance of a story idea if they’re making such a request. Nevertheless, the key point here is that there are many paths to finding a dataset.
Exploring the Data
Once they have a copy of the data, journalists will often explore it to get a better sense of what is in the dataset. This could just mean quickly going through a portion of the data file using a spreadsheet program and reviewing any supporting documentation for that dataset.
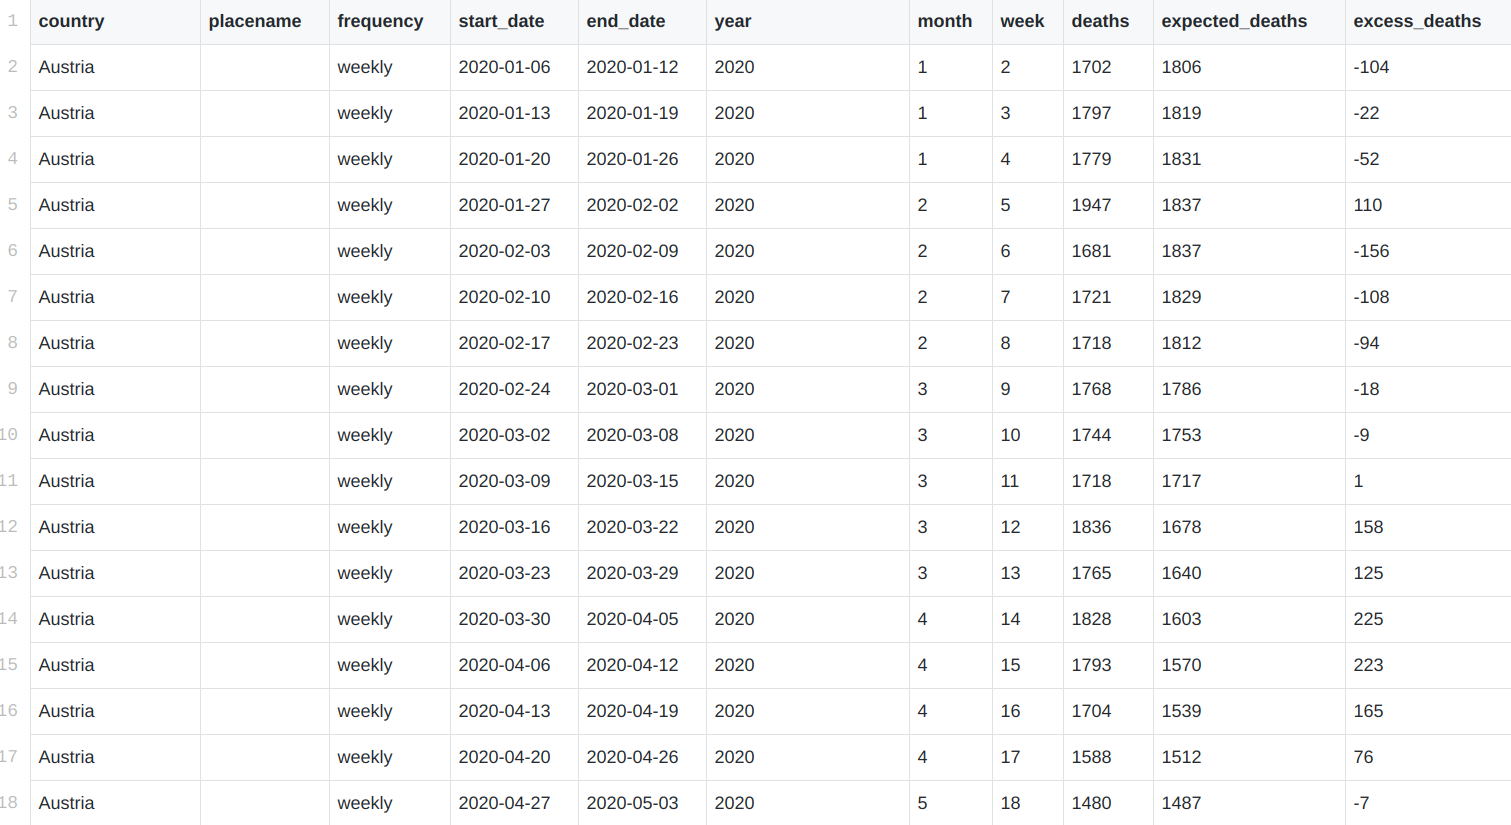
By doing so, journalists are able to answer important initial questions, such as: What kinds of variables are included in the dataset? What is the scope of the data? What kind of knowledge can I get from an analysis of these data?
Developing a Story Idea
After some initial exploration, the journalist will start to get a sense of the stories that might exist in those data. From there, they will start to prioritize what the most interesting and important stories are likely to be, and what other data they might need to help tell that story.
For example, a journalist may come across a new dataset on standardized exam performance in the Commonwealth of Massachusetts and wonder if there is a relationship between the average income of the people living in a district and the performance of the schools in it. Alternatively, using that same dataset, the journalist may wish to identify the schools in poorer districts that are performing exceptionally well in order to produce a story about what is working in those places.
As the story idea develops, the journalist may realize that the dataset they are working with does not include all of the information they need to execute the idea. Thus, they may begin to seek out complementary datasets, such as U.S. Census Bureau data about the average incomes in different towns and cities. If they are able to find such data, they will typically combine the datasets into one master file that contains the variables that interest them most. Quite often, though, they will find that the complementary data they want does not actually exist — and they must therefore either rethink their story idea or accept that they’ll have to rely on anecdotal information to supplement their data analysis.
Cleaning Datasets
Before really digging into the data, it’s important to “clean” the data to make sure they “look right.”
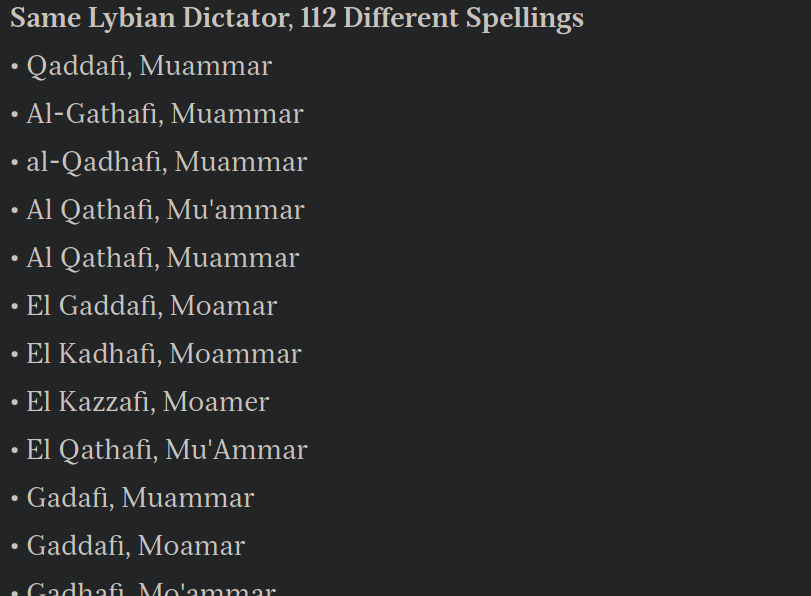
The idea of cleaning data may sound nefarious, but it’s really not. Datasets often have typos or inconsistencies. For example, if I receive two different speeding tickets, the first officer may spell my first name as “Rodrigo” in the official record while the second officer, who recently read Shakespeare’s Othello, may incorrectly spell my name as “Roderigo.” These records would need to be manually corrected in the resulting dataset by a journalist prior to the their analysis, in order to accurately reflect that I received two speeding tickets.
While it can sometimes be impossible to manually review every data point, journalists tend to perform simple ‘sanity checks’ to identify common issues. For example, they may check for dates that fall outside of the expected date range or for extraordinarily large numbers — indicators of potential data entry errors. Sometimes, the journalist may be able to correct the data themselves but often they must circle back to the data collector to correct the issue.
It is important to note that seemingly small errors can cause major problems when it is time to analyze the data because it can result in important data points being left out of the analysis or having skewed results. Notably, the cleaning step can sometimes be the most laborious and time-consuming step in producing a data-driven story.
Data Analysis
After the data have been cleaned, it is time to really hunker down and analyze it. This may involve aggregating some of the data, taking out a slice of it, or performing different statistical tests.
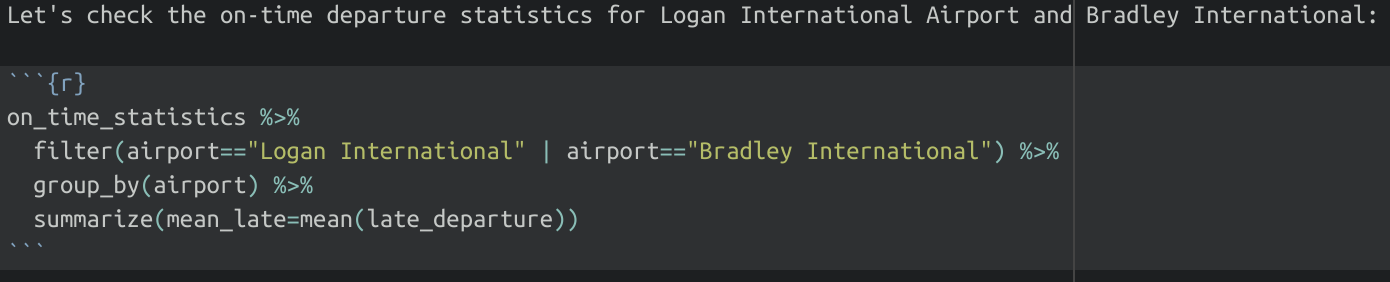
For example, a journalist might start with a clean dataset that has all the on-time statistics for all U.S.-based airlines in 2020. They could then calculate the percentage of flights that departed 15 minutes or more after their scheduled time. From there, they can narrow it down to just a handful of regional ports of departure, like Logan International Airport and Bradley International Airport. Finally, they could take an average of the percentages for the course of the year, by airline, to identify which airlines and airports do the best job of leaving on time.
You can also think of the data analysis step as an interview of sorts. Just as a journalist might come up with a list of questions before heading into an interview with a human source, they might also generate questions they would like to ask of the data — and then perform the analyses necessary to answer those questions. And, just like a typical interview, the answers may generate follow-up questions, or even take the interview in an entirely different direction.
Supplemental Reporting
After the journalist has performed some analysis of the data, they will usually want to do some traditional reporting to supplement it. This might mean trying to find a person who has a strong anecdote that would illustrate the data analysis, contacting some expert in that area to help contextualize the analysis, or seeking out documents that help explain the findings from the analysis.
While data journalism does not require this step take place, the more interesting examples of data journalism go beyond simply describing a data analysis. That’s because human beings help to make stories interesting — they’re just more relatable than numbers — and it is generally beneficial to include human sources in a story in some way. Additionally, during the process of further reporting the story, a journalist might find that there is an important relationship they have not yet explored, or they may find that their conclusion might have been inaccurate because they omitted an important variable or misunderstood a key assumption.
This step is often iterative. Put another way, journalists will often go back and do some more work in the analysis step, which will draw out new questions and ideas that must be addressed via the supplemental reporting.
Producing and Publishing the Story
After the story has been reported, it is time to produce it. People do not turn to news media outlets for research reports, so it is important to craft a story that is not just informative but also compelling. This is where the journalist incorporates a strong lead, interesting quotes, and a gripping narrative arc. This step is very similar to what a journalist would experience when producing a typical news story, but it does require honing the ability to make quantitative information compelling. (For most people, numbers are a bore!)
An optional step, but one that is found in many data-driven stories, is visualizing the quantitative information. This is part of making the story more compelling to audiences. It not only makes it much easier for people to understand data in context but it can also give them the ability to interact with the data and come to their own conclusions. Put another way, the visualization step can be a way of making the story more interesting, engaging, and informative.
When all of these steps are completed, it is time for the big conclusion: publishing the story. A data-driven story may appear on a digital platform or an analog one, and it can take many different forms, from a text-driven web story to a podcast that mixes narration with sonification (using audio to represent data). This final step is, of course, crucial since the purpose of journalism is to inform the public.
We will be covering each of these steps in detail in the coming lessons.