Cleaning Datasets
Introduction
When we extract data from PDF files, we often find little errors introduced by the program’s detection algorithms. Put another way, the program has to guess how to piece together the information in the PDF — and, sometimes, it just guesses wrong. (For example, it might read $1,150 as $1, 150 — notice that extra space — which can become an issue in R.)
All of those little issues can be cleaned up within R but it is sometimes faster (and certainly easier for beginners) to clean the data using spreadsheet software. In this case, we will use Google Sheets. (However, LibreOffice Calc and Microsoft Excel can do the same thing.)
Advanced data journalists will sometimes used more advanced programs like OpenRefine that use advanced algorithms to detect and correct errors in a dataset. If you’re up for a challenge, you can play with that as well.
Opening the Data in Google Sheets
To open a dataset in Google Sheets, first sign in to Google Drive. Then, click on the New button on the top-left of the screen and select Google Sheets.
An empty spreadsheet should appear.
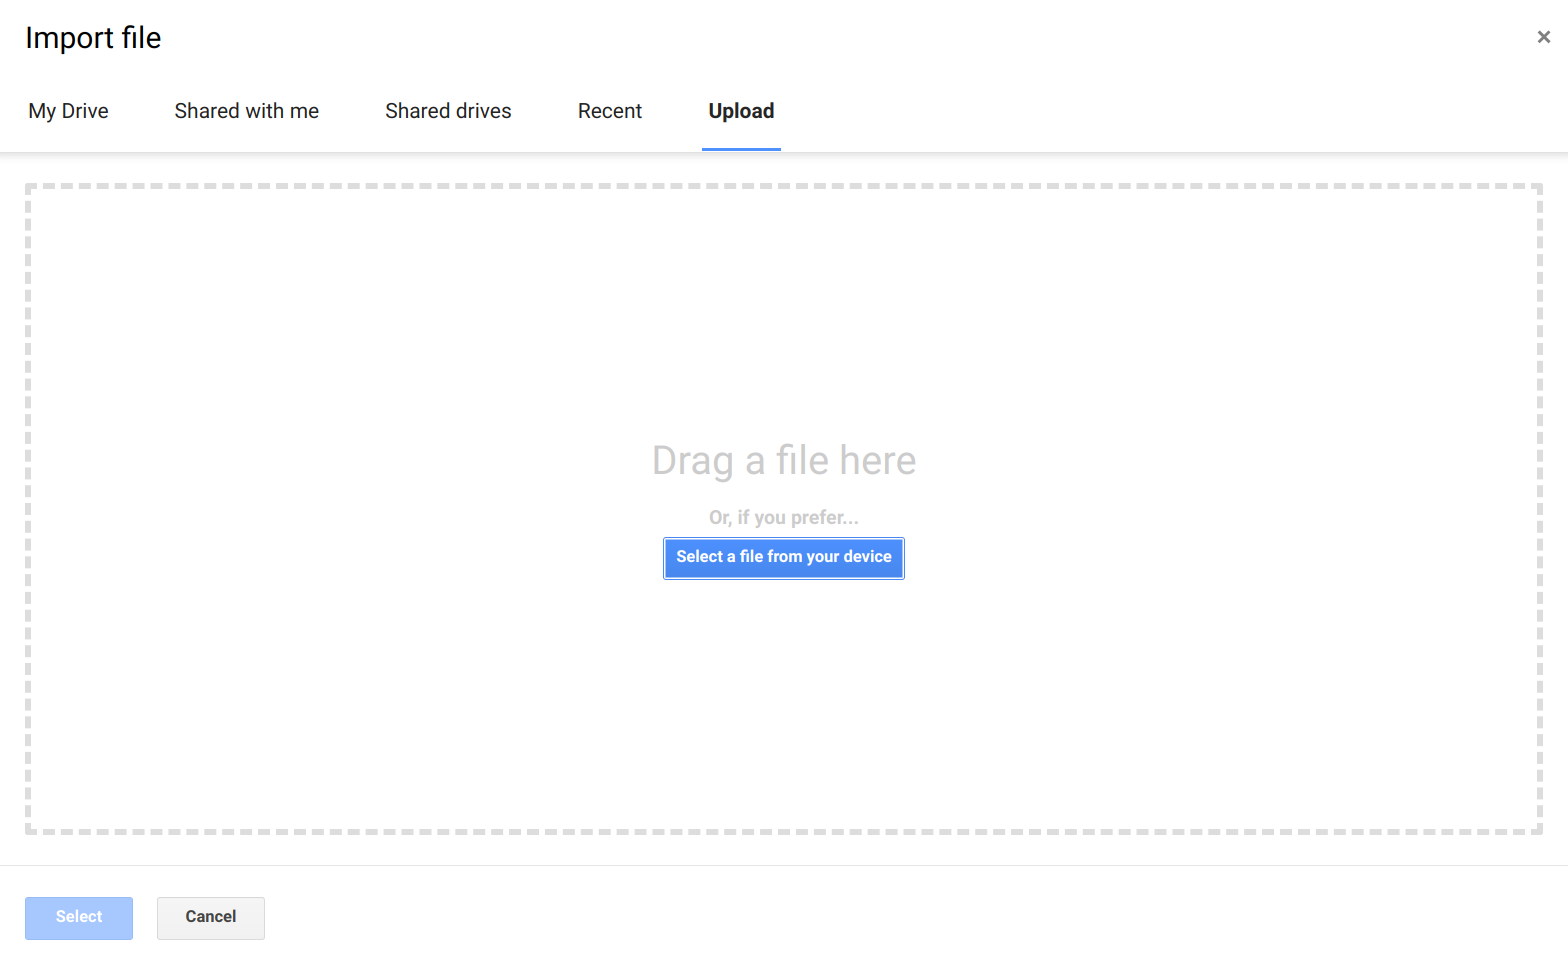
Click on File and select Import. Select the Upload tab and select the CSV file you want to import.
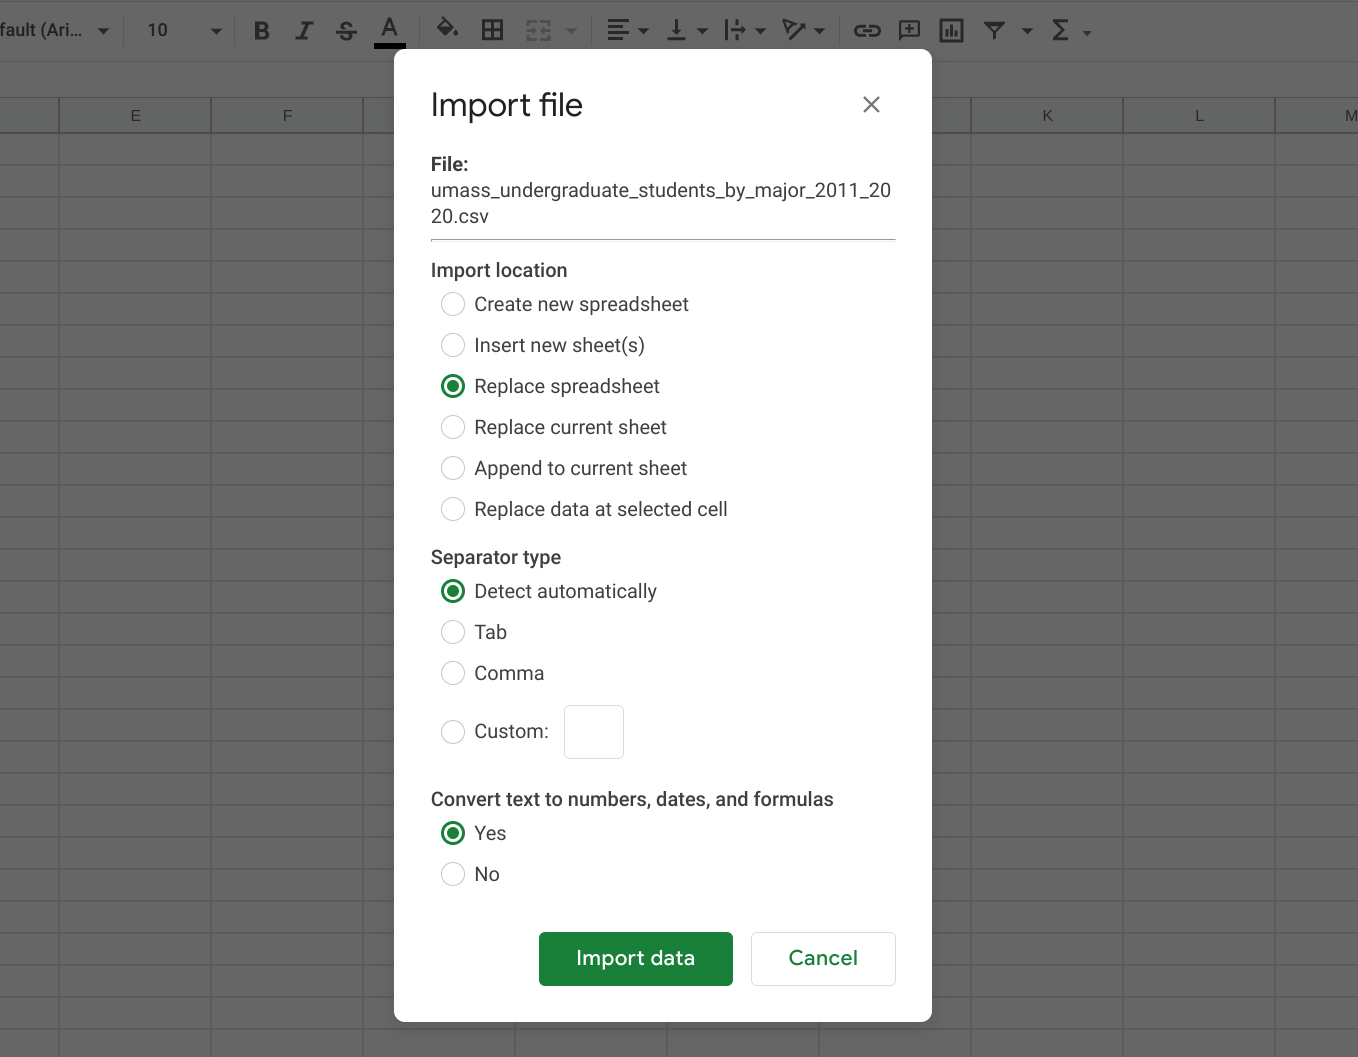
For the purposes of this tutorial, we will be using the CSV file that I extracted using Tabula in the “Extracting Data from PDFs” tutorial. Just save this file onto your computer to follow along. These data correspond to the spreadsheet on that tutorial.
We can keep all of the default settings in the import screen that follows.
This should refresh the page with a new sheet that contains all of the information Tabula extracted.
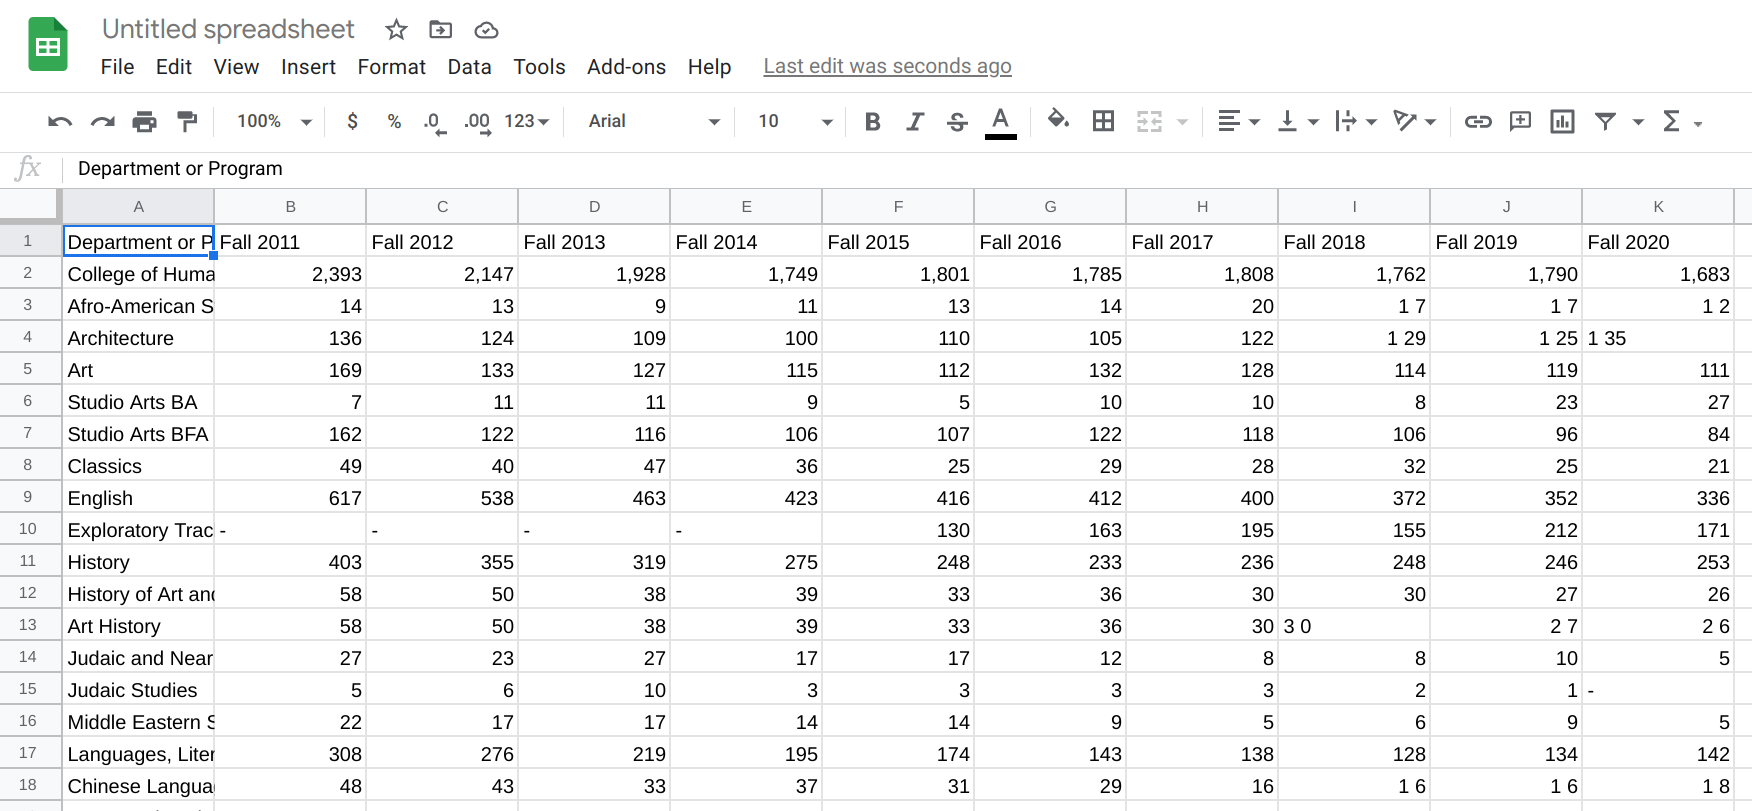
Modern spreadsheet software will often correct some things for us — but it rarely corrects everything (and in some cases, makes matters worse by trying to be helpful). For example, we already see a few issues here: some cells have spaces in them and are treated as text (e.g., 1 35 on row 4, column K [which we reference as K4]) while others are treated as numbers (e.g., 111 on K5). We also see that some cells have a dash (-) to signify the cell is empty (e.g., B10). All of these are issues we’ll want to fix before doing our analysis in R.
Many advanced data journalists prefer to use R even for data cleanup because it is more systematic and is easier to repeat if additional data are appended to the file later on. However, it’s sometimes faster to clean things up using a spreadsheet program, and that is certainly if you’re new to R. So we will proceed with the spreadsheet program for this tutorial. However, you can look up advanced ‘data cleaning using R’ tutorials on the web if you’re interested in taking that route.
Setting Up the Header Row
Tabular data files are typically organized with a header row (first line) that lists the variables in the dataset — with each variable appearing in a different column. Each subsequent row represents an observation in the dataset (e.g., the number of students enrolled in a specific department).
Let’s begin by setting up our header row. The first thing I like to do is double-check that I have useful and well-formatted variable names in my header row. With smaller datasets like this, I typically strive for a descriptive, human-readable name. I also try to remove any spaces or special characters from the name — this isn’t necessary, but it will make our lives easier when working within R.
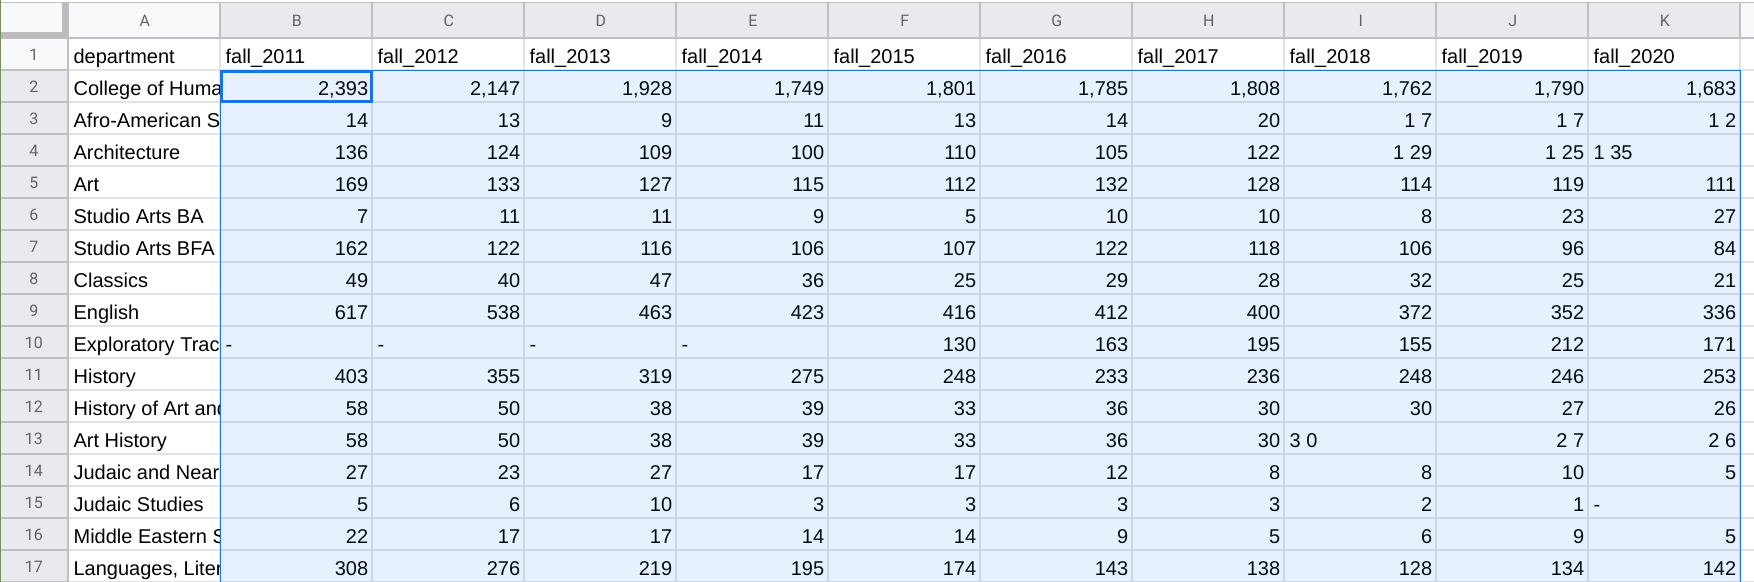
So, I’ll rename my variables thusly: department, fall_2011, fall_2012, fall_2013, fall_2015, fall_2016, fall_2017, fall_2018, fall_2019, fall_2020.
I will then check the second row of the file to make sure that there isn’t a continuation of my header row. (This often happens with multi-line headers in PDF files. Because of how we selected our data in Tabula, we don’t have this issue here.)
Since I know I had header rows elsewhere in my dataset (from Pages 2 and 3 of the PDF), now is a good time to find those and get rid of them. We see them in rows 66 and 127. To delete a row, just right click on the row number and select Delete row.
Removing Spaces in Numbers
The next thing we’ll want to do is remove all of the spaces so that 1 35 becomes 135. We can do that by first selecting only the cells we want to perform this operation on. For example, we do not want to do that to the first column (because it’s helpful to have a space for Political Science), so we would not select any cells in that column. Here’s an example of what my highlighting looks like:
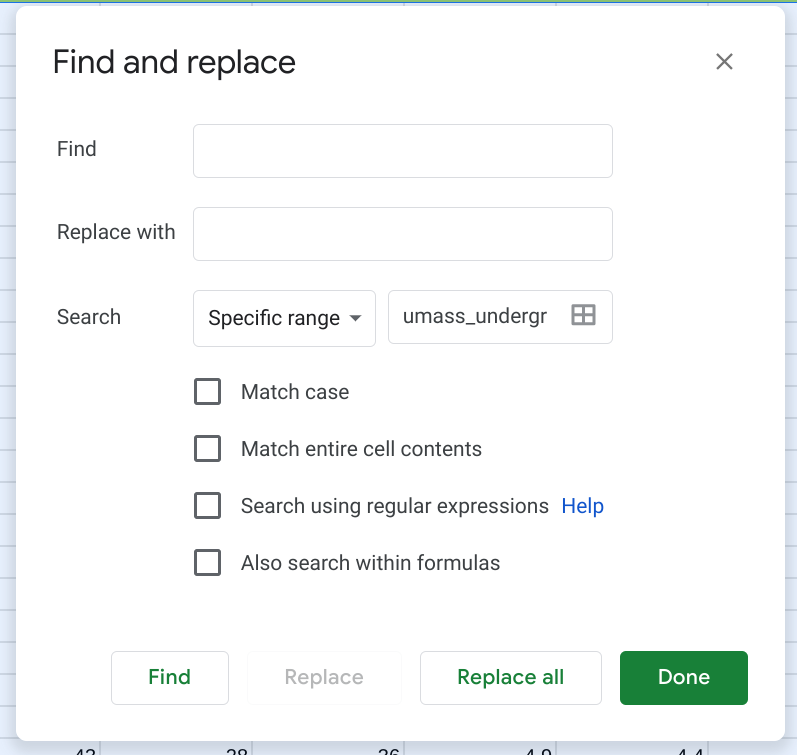
Once only the value cells have been selected, I can go to Edit, Find & Replace. Then, I can enter a single space in the box next to Find (i.e., find all spaces) and keep the box next to Replace empty (i.e., replace each space with nothing). It’s important that you ensure that the dropdown box next to Search reads Specific range (which should be automatically set to your highlighted area). This makes sure it doesn’t change anything with the non-selected cells. Then, click Replace All.
This should remove the spaces from all of the offending cells. (Your will also see some changes to the alignment of the values in their cells. This indicates a shift from being “Text” values to “Numerical” values.)
Removing Special Characters from Cells
We can go back and select those same cells and do another find and replace, this time removing the dashes (-) and replacing them with nothing.
If we had any cells that should have a dash in it (e.g., a cell that represents a date range, like 2020-2021), then we could also select the check box that reads Match entire cell contents. In this case, we don’t have such values so we can leave the box unchecked.
Make sure you do not replace the dashes with 0, as zero has a numerical meaning. Instead, we’ll keep it blank to denote that we don’t have any data for that point.
Removing Formatting
By default, most spreadsheet software (including Google Sheets) will try to make numbers easier to read for us by adding things like thousands separators (i.e., 1000 becomes 1,000) and percent signs (e.g., .05 becomes 5.00%). However, in trying to be helpful, those software can create problems for us down the line. Specifically, if it saves those data as 1,000, some programs (including R) may treat is as a string value rather than a numerical one (more on the implications of this, and how to correct it, in a later tutorial).
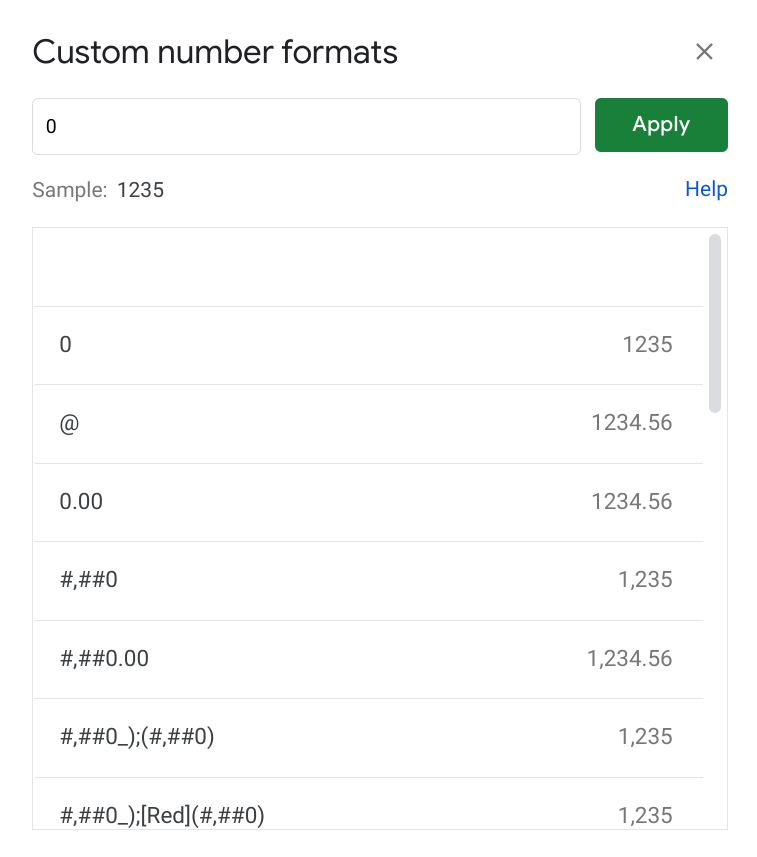
To prevent this from becoming an issue, we can just tell Sheets to not include any separators. We can do that by selecting the region with all of the numerical values (e.g., B2:K172, or from B2 (top-left) to K172 (bottom-right)), going to Format, Number, More Formats, Custom number format.
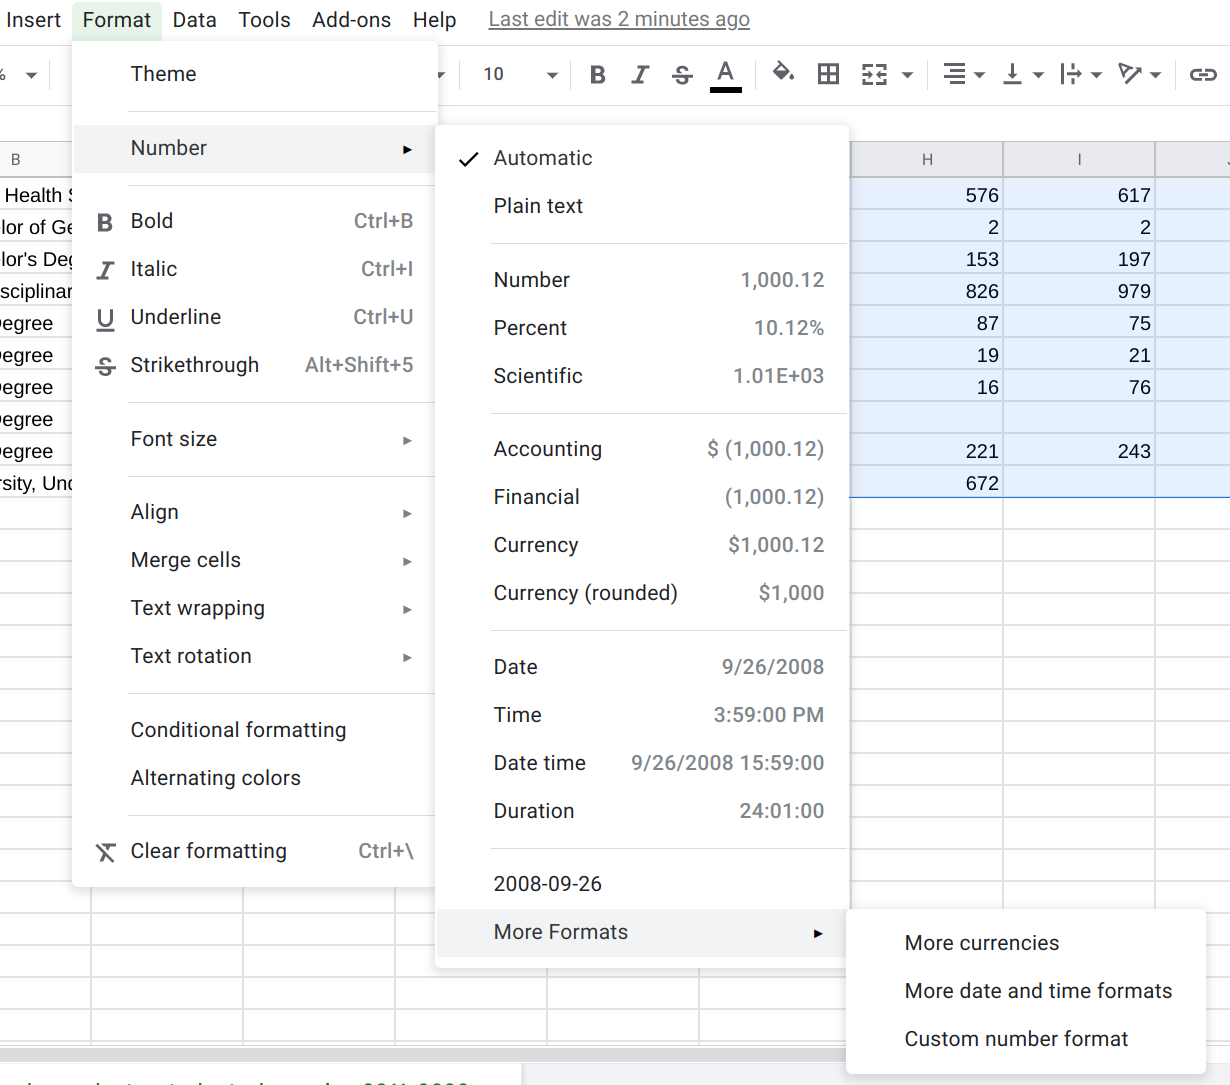
Then, just type in 0 in the text-box (or select it from the list of options). This will turn it into an integer. (We would need to select a different option if we had numbers with decimal points, of course, such as 0.00.)
Un-Nesting Data
Our PDF file includes what is called “nested data.” What this means is that some rows in our dataset are “children” (sub-units) of a “parent” row. For example, let’s refer back to the original PDF file our dataset is based on:
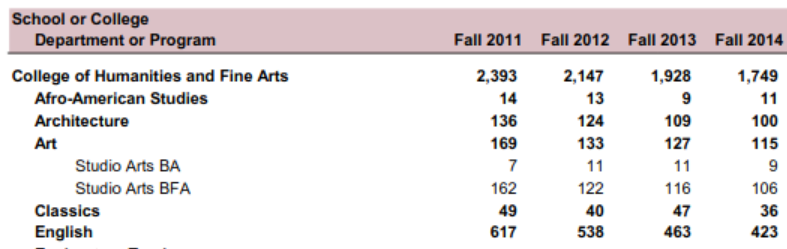
Notice now we have a parent category of “College of Humanities and Fine Arts.” Underneath it, we have a department: “Afro-American Studies.” Some departments have children of their own (sub-programs). For example, “Art” has a “Studio Arts BA” and a “Studio Arts BFA.”
This becomes an issue because we sometimes have departments that share a name with their sub-program, such as “Linguistics.” More specifically, this can make it harder to correctly filter data in R (or know exactly which academic unit our results might be referencing when we get duplicates).
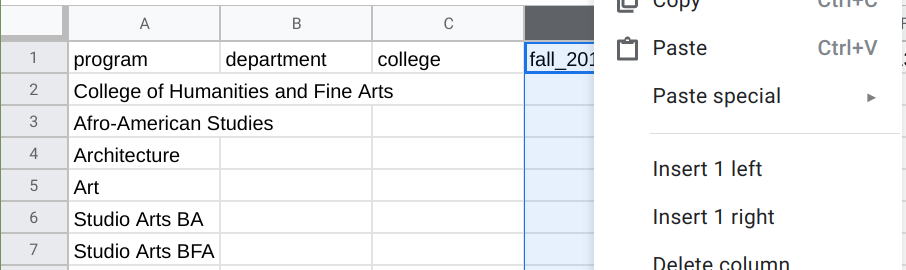
It thus makes sense to reorganize our data by adding dedicated columns for program, department, and college. We can do that in our spreadsheet by right clicking a column (e.g., B) and selecting the appropriate Insert option (e.g., Insert 1 left). Your spreadsheet might thus look like this:
Now, we will just need to do a lot of copy and pasting. For example, I can type “College of Humanities and Fine Arts” in C2, copy that cell (go to Edit, Copy or just press Ctrl+C (Windows) or Cmd+C (Mac)), highlight all of the cells down to C45, and paste that value (go to Edit, Paste or just press Ctrl+V (Windows) or Cmd+V (Mac)).
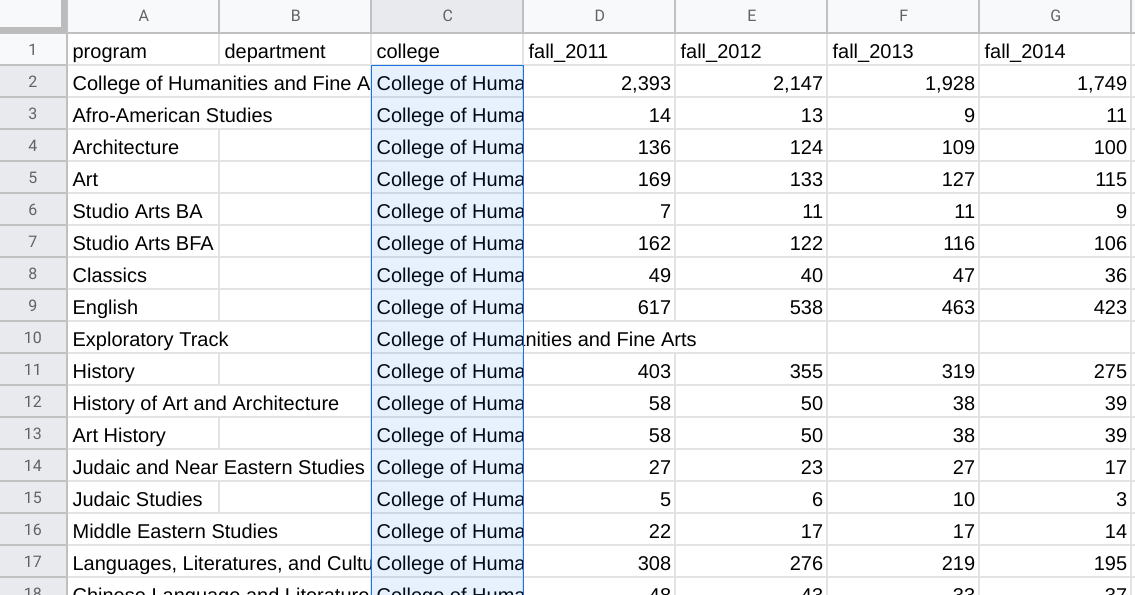
I would continue to fill in all of the cells for the columns I created so that each row represents a distinct academic unit.
The CSV file we are working with also includes totals for each “parent” unit (e.g., there is a row containing the totals for the “College of Humanities and Fine Arts”). Those totals can be seen as a form of duplication since they represent the sum of observations already found in our dataset (i.e., the total of their “child” units.)
To reduce confusion, I would advise removing totals from the dataset and calculating them ourselves in R when needed. Put another way, I would only keep the lowest-order “child” units as observations (rows) in my cleaned dataset.
As you might imagine, all of this copying and pasting can introduce errors. I would advise spot-checking your spreadsheet against the original PDF file. Later, when you are more comfortable with R, you can also perform some ‘sanity checks’ to identify extreme values or inconsistencies that might suggest the introduction of human error (or an error from when a program originally extracted the data from the PDF file).
Exporting the Revised CSV File
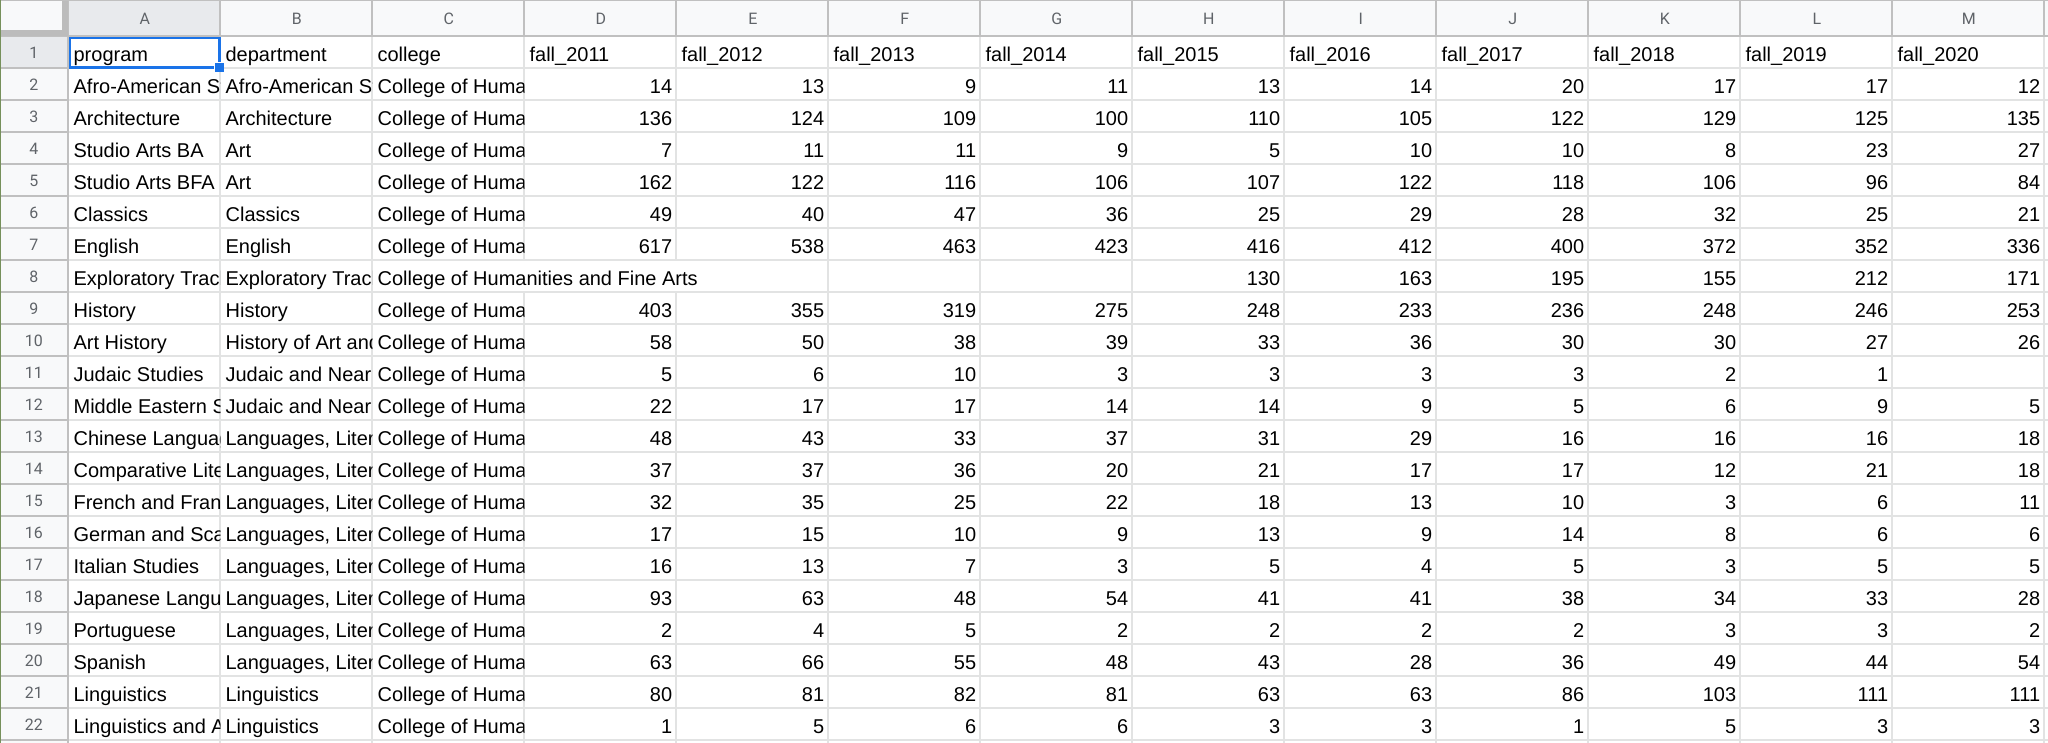
After all of my copying, pasting, and correcting, here’s what my spreadsheet looked like.
Once you’re done with all of your corrections, we’ll want to export our CSV file to bring into R. You can do that by going to File, Download, Comma-separated values (.csv, current sheet).
Please do note that Sheets will only save the active tab on your spreadsheet as a CSV file. (That’s okay in this case since we only have one.) If you have multiple tabs/spreadsheets, you will need to save each tab as a separate CSV file and merge them in R (or simply combine them into one spreadsheet within Google Sheets).
If you wish to inspect my ‘cleaned’ CSV file more closely, here is a copy of it. You can compare it against yours to see if you missed anything.