Structured Data and Data Formats
Introduction
Data journalists encounter a variety of data over the course of their reporting. It is thus important to first understand if the data file you will be working with is structured or unstructured. Second, it is important to understand what format the data are in.
The structure and format of the data can impact how you analyze the data and whether any intermediate steps are necessary before you can begin the analysis.
Structured vs. Unstructured Data
Let’s start by looking at the differences between structured and unstructured data.
Structured Data
Structured data are those that have a predefined data model or are organized in a predefined manner. With structured datasets, the data are already split into distinct units that can be easily accessed.
For example, you might have a tabular dataset with data about player transfers in the English Premier League. Each row in that dataset represents a different transaction (e.g., the sale of a player from one team to another). Each column represents a different variable (i.e., attribute about a transfer). Those variables might include the soccer team performing the transaction, the player’s name, the amount of money involved in that transaction, the player’s age, and so on.
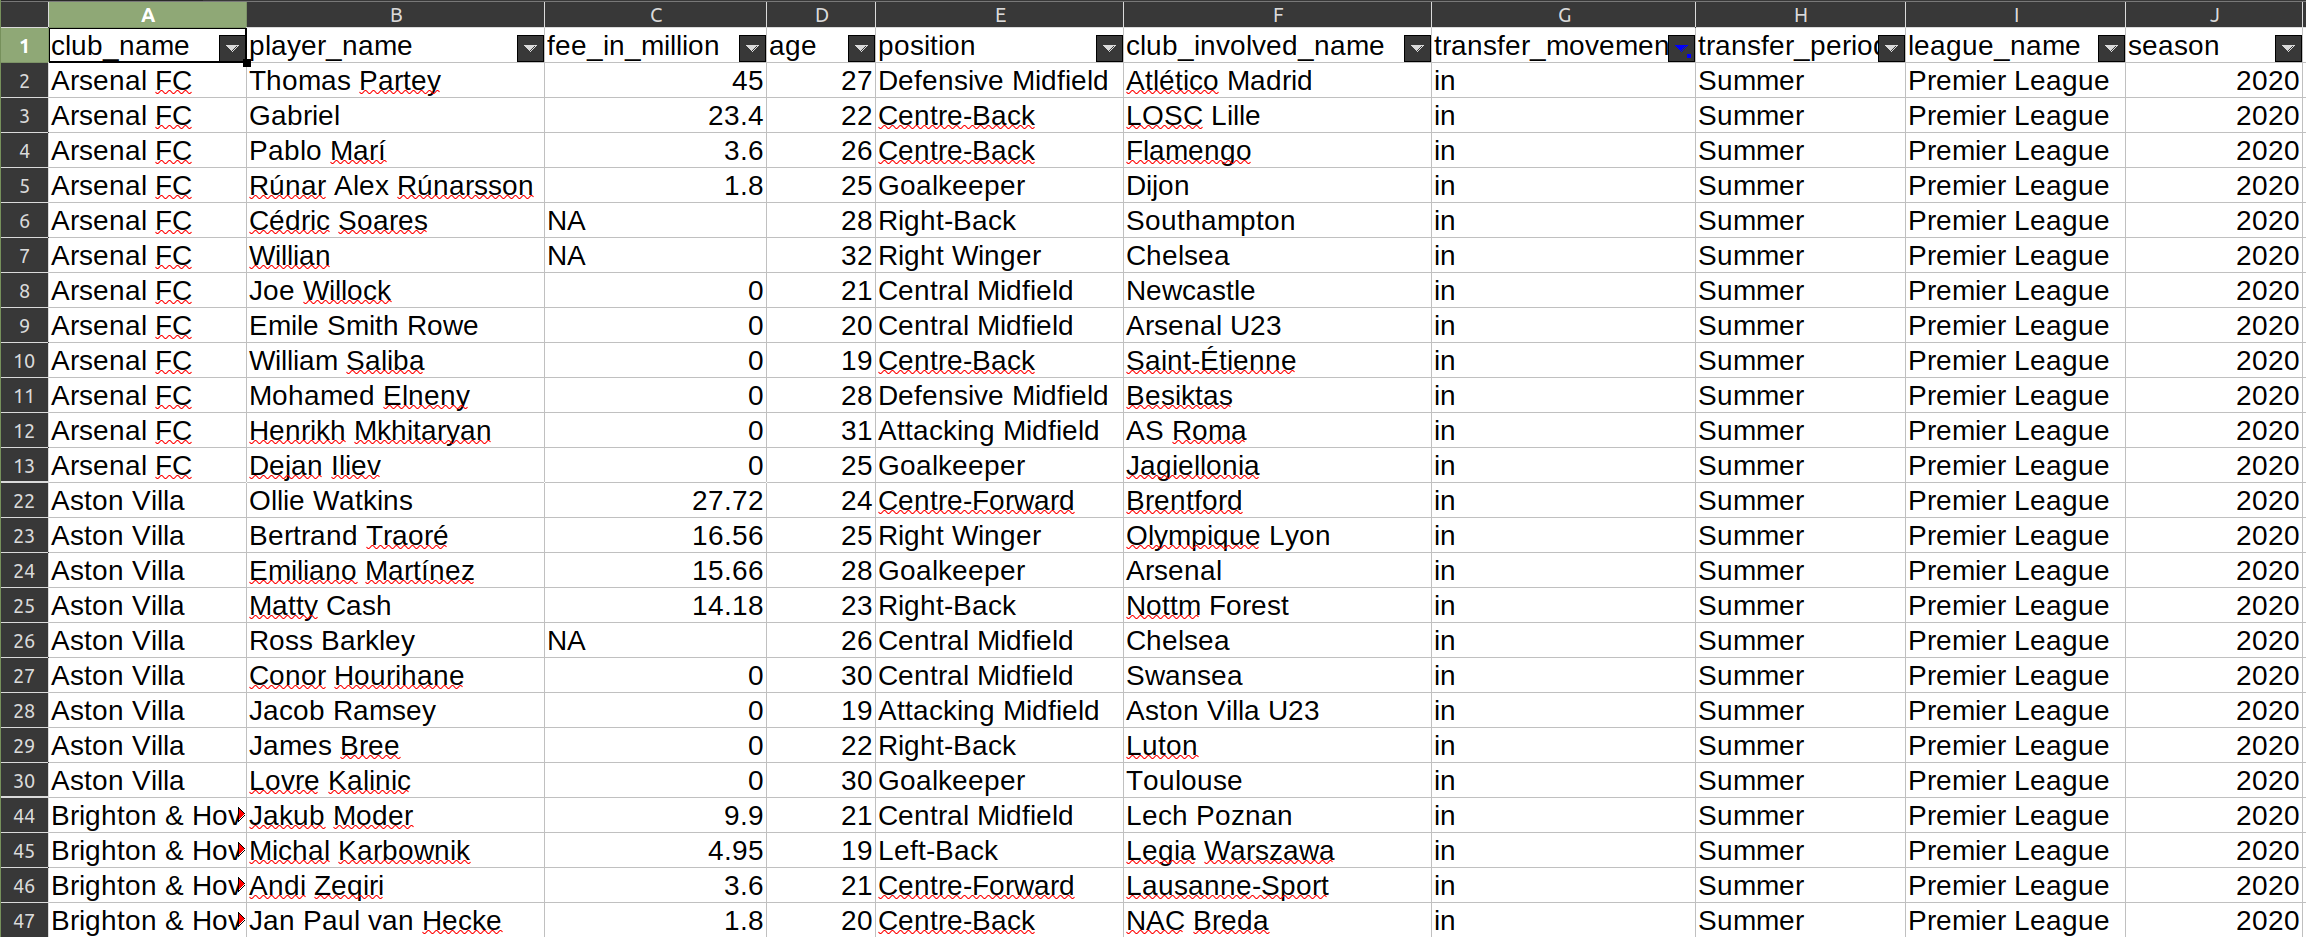
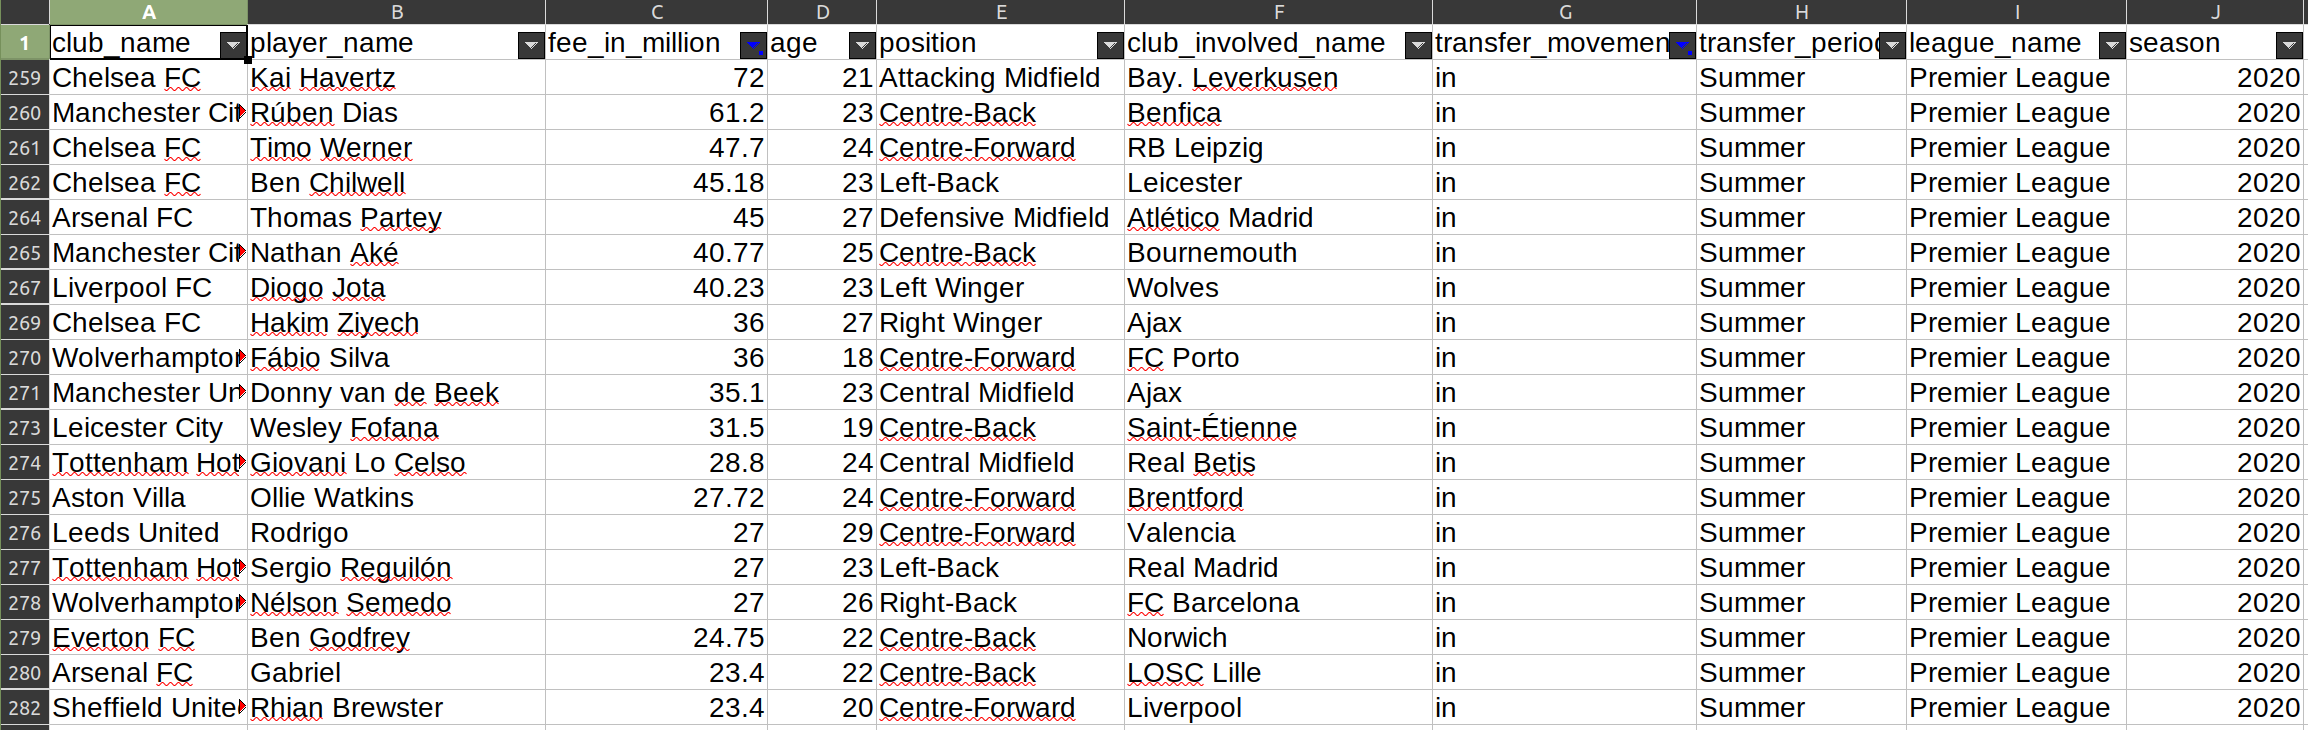
With a dataset like this, I can easily sort the information. For example, with minimal effort, I can sort transactions by their transfer fee to identify which player cost the most money. I could also easily aggregate the data to calculate the total transfer amount paid by each team, and then sort those data to quickly find which team spent the most money on player transfers that season.
For the purposes of data-driven storytelling, you will want to try your hardest to get the data in a structured format because it will make your life way easier when it is time to analyze the data and will generally include fewer errors in the dataset.
Unstructured Data
Unstructured data are just the opposite. Those data do not have a predefined data model and are not organized in a predefined manner. They cannot be readily split into separate units, sorted, or subset.
For example, let’s say I have that same information in a block of text (like in a Google Doc). There is no way I can have my computer quickly identify the players with the highest transfer fee.
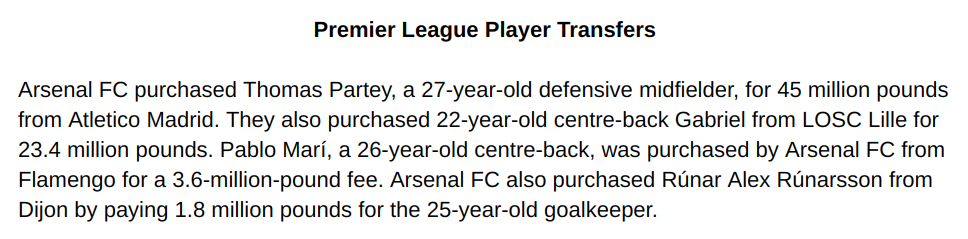
I can of course manually look through all of the text and pick out that player but if I want my computer to do it, I would need to find some way to transfer that information into a structured dataset. That is not always easy, especially if the information is written for human consumption. (For example, it expresses each transfer through a different sentence structure in order to make it more interesting for a reader.)
A data journalist might try to develop a computer script to try to automatically make sense of the text and store it as structured data (i.e., a scraper), but such endeavors often produce some conversion errors that need to be manually corrected. (For example, it might “guess” incorrectly and store information under the wrong variable, or not be programmed to account for a rare variation of the sentence structure.)
Semi-Structured Data
There is also a category of data that fall in between those two types: semi-structured data. These data are not provided as structured data (i.e., a structured data file that you can download) but nevertheless contain some structure in order to be presented correctly.
The most common example of semi-structured data that data journalists run into are those stored on webpages (e.g., HTML files). For example, consider the following table:
| Club Name | Player’s Name | Fee (in million) | Player’s Age | Position |
| Arsenal FC | Thomas Partey | 45 | 27 | Defensive Midfield |
| Arsenal FC | Gabriel | 23.4 | 22 | Centre-Back |
| Arsenal FC | Pablo Marí | 3.6 | 26 | Centre-Back |
| Arsenal FC | Rúnar Alex Rúnarsson | 1.8 | 25 | Goalkeeper |
In order for your browser to correctly render that table, some web code was used to create each cell and insert specific text into it. However, the document that contains that table (i.e., this page) also includes a lot of additional information (i.e., the text of this lesson), and you thus can’t simply open it in a spreadsheet software to get the desired data.
When journalists encounter semi-structured data, they are usually able to write simple programs (scrapers) to capture that data and store it in a structured way. Those scrapers tend to introduce less conversion error because there is some predictable structure that it can follow to correctly identify and organize the information.
You can often copy and paste from a table on a webpage to spreadsheet software like Google Sheets or Microsoft Excel. Those programs also have a Paste Special option that allows you to remove all of the formatting (e.g., bolding, different font sizes, etc.), which can be quite handy for helping us just focus on the information we need.
Do note that if that table had been presented as an image (i.e., a screenshot of it), that would be an example of unstructured data. We would need to find a program that can “read” the image file, first by converting the image to text (i.e., via optical character recognition, or OCR) and then by detecting the column and row separators. This process often introduces a great deal of conversion error.
A Word About PDFs
Data journalists often come across really useful data stored in PDF documents. Although they are fantastic for a lot of things, PDF files are a big headache for data journalists.
PDF stands for Portable Document Format. It was developed by Adobe Systems in the early 1990s and is now the de-facto standard for presenting documents because it provides a fixed layout structure that allows things to look pretty much the same across software, devices, and operating systems.
The challenge with PDF documents is that the data are not stored in a structured format that is useful for data journalists. Instead, they are stored in fixed positions or in relation to other text and non-text objects. To put it simply, we usually can’t just copy and paste data from a PDF file onto Google Sheets and get a clean spreadsheet.
Thankfully, there are tools out there (such as Tabula and free online conversion tools) to help us get data out of PDF files and into a structured format that we can use for data exploration and analysis. However, those tools typically won’t work as well as you’d hope and a fair bit of ‘data cleaning’ will thus be necessary.
If you come across interesting data only available as a PDF file, try to use those a tool to extract the data. If your PDF document is a scanned file (you can’t select the text, for example), you may need to perform optical character recognition (OCR) on it using some software or online service before even feeding it to a PDF converter.
Some PDF readers have OCR functionality built in, so you might already be able to do that with your computer. Alternatively, you can search the web for services that perform OCR for you for free. The results do vary considerably across tool, though, so you may want to try a few different ones.
If the data are only available via a PDF file, try contacting the party that produced the document and request those same data in a structured format. They might just say ‘yes’ and save you a lot of trouble. However, if you can’t get those data in a structured format and the automated conversion produces poor results, some good old manual data entry work is likely to be the best solution.
Structured File Formats
Some data sources will make the data available in multiple file formats — though you will often only have access to a single one. It is often possible to convert from one file format to another yourself, but you will need the software necessary to open the original file and the conversion process could mess some things up in the data. (Put another way, be sure to perform some “sanity checks” after any conversion to ensure that the converted dataset looks to be consistent with the original one.)
CSV Files
CSV (“Comma-Separated Values”) is a very common file type for storing structured data. It is just a simple text file that uses a comma (,) as the delimiter (the notation used to separate each value in the dataset). Put another way, each variable — or column, if are were thinking in terms of a spreadsheet — is separated by a comma. (If a data point consists of text that has a comma, it will often be surrounded by quotation marks to signify that it is all part of the same value, or cell in spreadsheet terms.)
You will sometimes see an option for a TSV (“Tab-Separated Values”) file. These files are generally identical to their CSV counterparts except they uses a tab as the delimiter rather than a comma. Most software also support TSV files but they are less common today than in the past.
The first line of a CSV file will usually contain the variable names. Each subsequent row represents a different observation (or row, if we are thinking in terms of a spreadsheet), such as a different player’s name. Here’s a sample of our earlier example, expressed as a CSV file.
club_name,player_name,fee_in_million,age,position,club_involved_name
Arsenal FC,Thomas Partey,45,27,Defensive Midfield,Atlético Madrid
Arsenal FC,Gabriel,23.4,22,Centre-Back,LOSC Lille
Arsenal FC,Pablo Marí,3.6,26,Centre-Back,Flamengo
Arsenal FC,Rúnar Alex Rúnarsson,1.8,25,Goalkeeper,Dijon
Arsenal FC,Cédric Soares,NA,28,Right-Back,Southampton
The main downside of CSV files is that it has no formatting whatsoever, so it is not possible to designate a column as a number or a date. Many programs can guess the formatting correctly in many cases, but it can get tricky. For example, if the CSV file expresses one thousand dollars as $1,000 as opposed to 1000, the program may struggle to decide if that should be a number or a piece of text, and might refuse to perform certain operations as a result. (Put another way, you may need to specify the data type for a column when importing data from a CSV file.)
The main upside of CSV files is that they can be opened by just about every single data analysis program without any problems. Because it is so simple and open, it is the preferred file format for many machine-generated datasets (e.g., when you use a website to select a small portion of the data and ask to export it).
Notably, data journalists tend to make their data available as CSV files when posting them publicly.
Excel Workbooks
When looking for structured data produced by businesses, non-profits, and governments (especially at the local level), you are likely to encounter Microsoft Excel workbooks. That’s because spreadsheets (and Microsoft Excel in particular) are simple to use yet powerful, and they have thus become the de-facto tool for basic number-crunching in the business and public realms. Excel documents in particular will have the filename extension of “.xls” (older versions of Excel) or “.xlsx” (newer versions of Excel).
The main downside of Excel files is that they are intended to be opened by Microsoft Excel, which is proprietary software that costs money. There are other software that can open Excel files, like LibreOffice and Google Sheets, but they don’t always open the file correctly (since they often rely on the reverse engineering of the Microsoft Office specifications).
The main upside of using Excel is that it has a nice interface that is accessible to most people, and has sufficient functionality to do a lot of great analyses. The visual spreadsheet makes it really easy to glance at the data and get a sense of what is in the dataset. Excel is also a component of the Microsoft Office suite, which many people already have.
JSON Files
JSON files have become more common in recent years, although you are less likely to find these as an export option than either Excel workbooks or CSV files. Put differently, you are most likely to find these with geospatial data, like maps, or via Web-facing applications.
JSON stands for JavaScript Object Notation. It is also a simple text file but instead of using delimiters like commas, it uses attribute-value pairs and stored information through arrays. Unlike spreadsheets and CSV files, JSON objects are not tabular, so the data does not look like a simple square object with rows and columns. Instead, units can be nested so you have multiple countries and within each country, multiple states or provinces. JSON objects use square and curly brackets to separate units and attributes.
Here’s a sample of our earlier example, expressed as a JSON file.
{
    "club_name": "Arsenal FC",
    "transfers": [{
            "player_name": "Thomas Partey",
            "fee_in_million": "45",
            "age": 27,
            "position": "Defensive Midfield",
            "club_involved_name": "Atlético Madrid"
        },
        {
            "player_name": "Gabriel",
            "fee_in_million": "23.4",
            "age": 22,
            "position": "Centre-Back",
            "club_involved_name": "LOSC Lille"
        },
        {
            "player_name": "Pablo Marí",
            "fee_in_million": "3.6",
            "age": 26,
            "position": "Centre-Back",
            "club_involved_name": "Flamengo"
        },
        {
            "player_name": "Rúnar Alex Rúnarsson",
            "fee_in_million": "1.8",
            "age": 25,
            "position": "Goalkeeper",
            "club_involved_name": "Dijon"
        }
    ]
}
The main upside of JSON files is that it provides an easily navigable structure, which makes it convenient to programmatically access certain groups of units. It is also a plain-text file, so you don’t have to rely on proprietary software to access it. JSON files also don’t rely on a rigid structure like a tabular dataset (e.g., CSV and spreadsheets) which can be useful if different observations tend to have different attributes. (Put differently, if the same variables don’t tend to apply across observations, JSON allows you to only include the relevant variable for each unit.)
The main downside of JSON files is that it can’t be easily imported into most spreadsheet software or data visualization software. It can also seem confusing to newcomers at first. There are simple tools for converting a JSON file to a CSV one without worrying about conversion issues.
Other Common File Formats
Data journalists may also encounter SQL, SPV, and SAS files. Because these formats are less common for public datasets, I will only note a few brief features of each.
SQL files are inputs for many popular relational database management systems. They are usually only found with big, complex datasets, and require learning a lot of technical skills that we will not cover in this book. Advanced data journalists do occasionally make use of these more advanced systems, though.
SPV and SAS files are datasets for popular statistical analysis software. They are more common among academic datasets, and include a lot of additional metadata for the variables in the dataset. They also sometimes include information about the exact parameters used to run certain statistical analyses. Proprietary and rather expensive software is usually required to open those files, although R is capable of importing them (but sometimes introducing conversion error).
What to Look For with Data Files
Data can be stored in a lot of different ways, so it can get confusing when you’re trying to decide what kind of structure and format you want. To keep things simple, try to remember these two considerations.
First, always try to get structured data. If you are making an open records request, specify the exact format you’d like it in (as well as an alternative).
Second, when choosing the format, it is often best to go with the simplest format that can work across multiple software. For many data journalists, CSV files are usually the preferred choice.