Extracting Data from PDFs
Introduction
In this tutorial, we will be working with some data from UMass’ Office of University Analytics and Institutional Research. That office collects and reports many of the statistics about the UMass campus, such as admissions statistics, faculty-to-student ratios, and university expenditures. Specifically, we’ll be working with this spreadsheet containing data about undergraduate enrollment by major. (You will want to save that PDF file to your computer now.)
The goal of the tutorial is to extract data stored in a PDF document — a very common file type for disseminating quantitative information that presents challenges to data crunchers like us — and then save it as a CSV file that can be used by R or ‘cleaned’ using other software.
Installing Tabula
One great program for extracting tabular data (data stored in tables) from PDFs is called Tabula. This is a free, open-source product created with journalists in mind. It will basically take in a PDF file, allow you to select the data you’re interested in, and it will try to create a nicely formatted table and CSV file for your use.
Tabula sometimes works really well. Other times, it doesn’t work well at all. For the sake of this exercise, I’m selecting a real-world dataset that won’t give us too big of a headache.
The first step is to download Tabula here. Just select your operating system (Mac or Windows) from the left menu on that page and unzip the downloaded file.
Then, if you’re on a Mac, you should be able to just run the Tabula.app application directly from that folder. If you’re on Windows, you should be able to run tabula.exe. If you’re on Linux, check in with me.
If Tabula is refusing to load for you, you may need to download and install Java. You can also read some supporting documentation here.
In both cases, a browser window (e.g., Firefox, Chrome, or Safari) should open after launching the application. If it doesn’t, give the program a minute to load and then go this URL on your favorite browser: http://127.0.0.1:8080/.
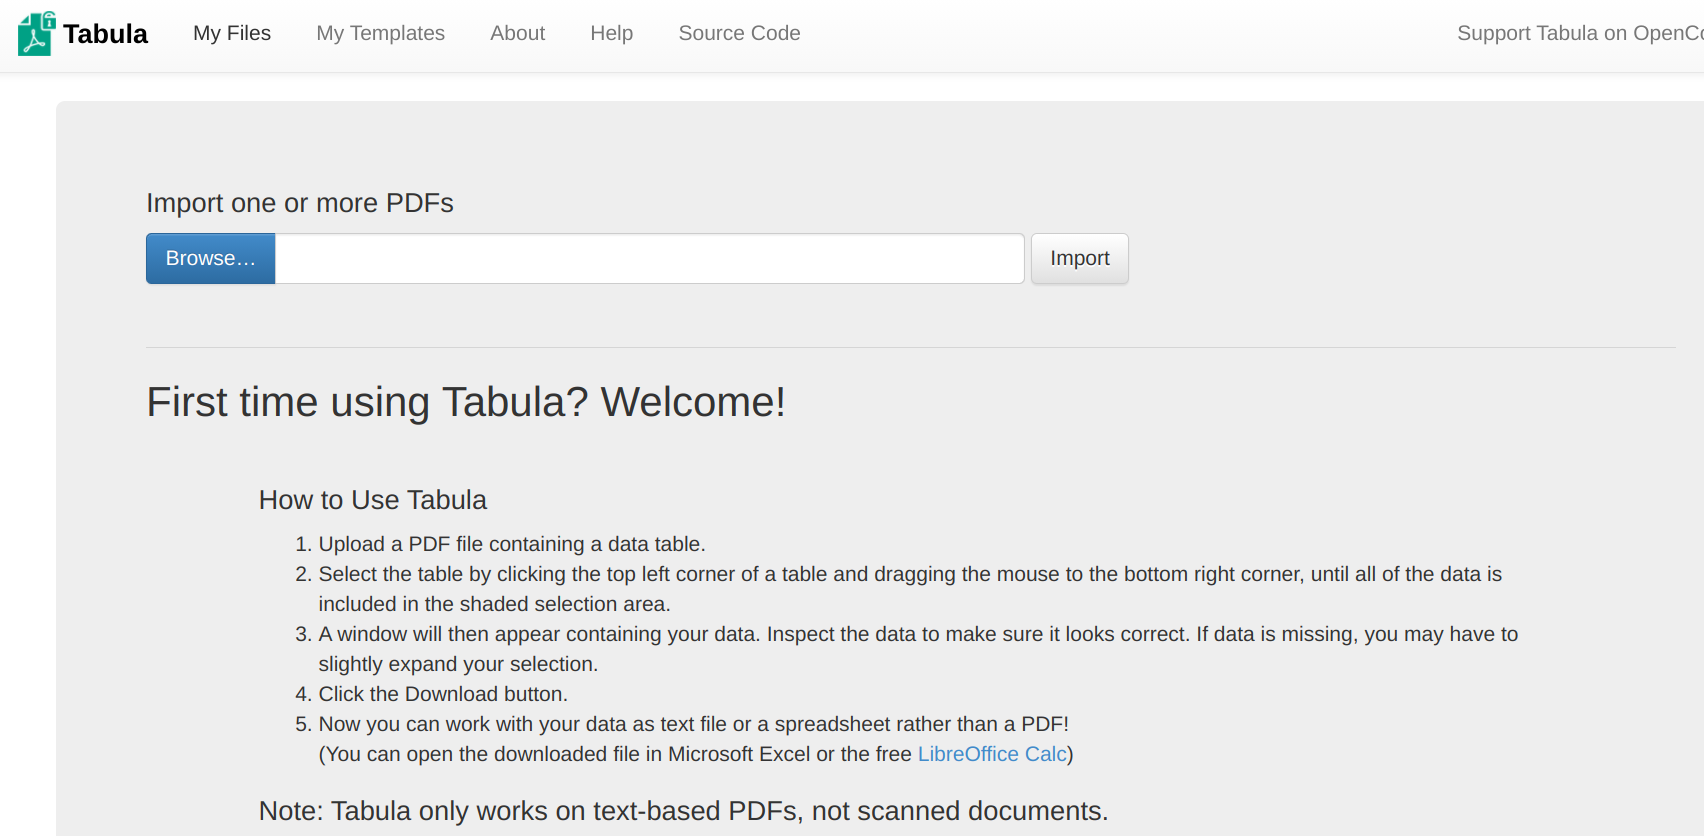
If you see a window like this, you’re in good shape:
Selecting the Data
To begin extracting data from your PDF file, click the blue Browse button and select the PDF file we want to extract information from. (In this example, that’s the PDF document you downloaded at the start of this tutorial.)
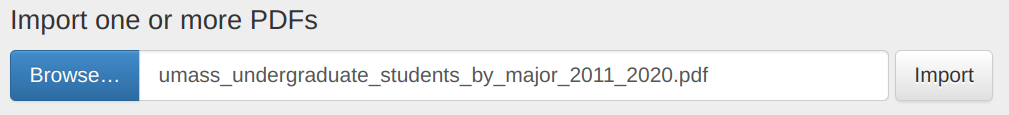
Once we have selected that file from our computer, we’ll click the nearby Import button. Tabula will spend a few seconds importing the file and automatically take you to a screen that looks like this:
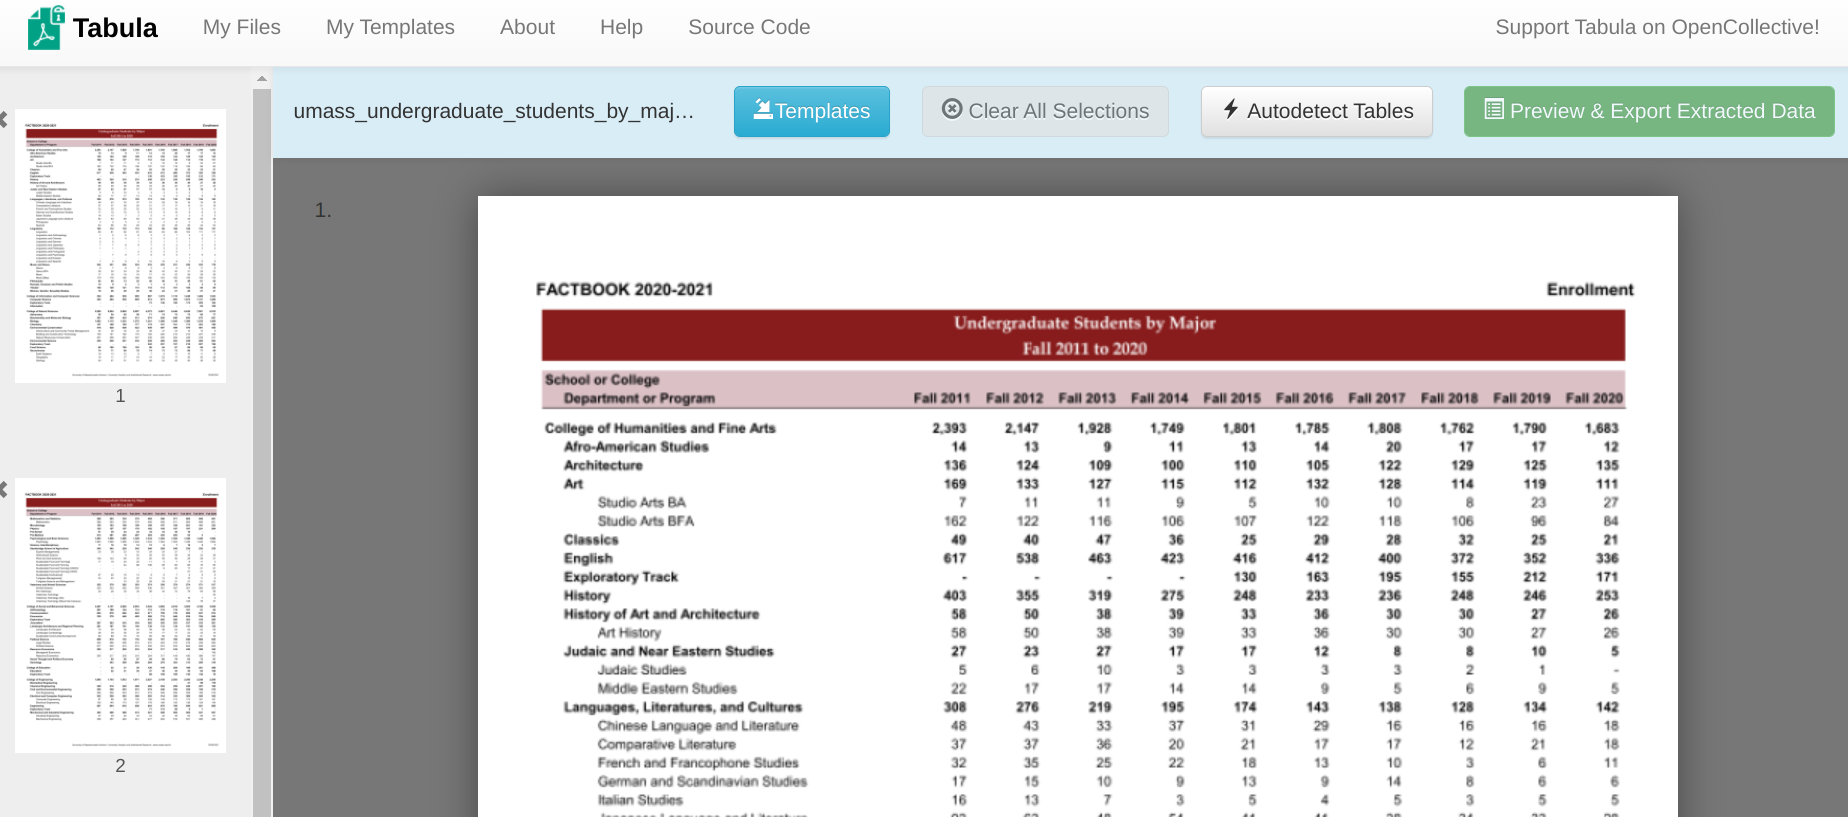
This screen gives us a preview of what our PDF file looks like and allows us to select the elements from each page that we want Tabula to try to extract.
The first thing I like to do is to see if Tabula can correctly guess where the tabular data are by clicking on Autodetect Tables. You’ll notice that a red box appears over the preview image:
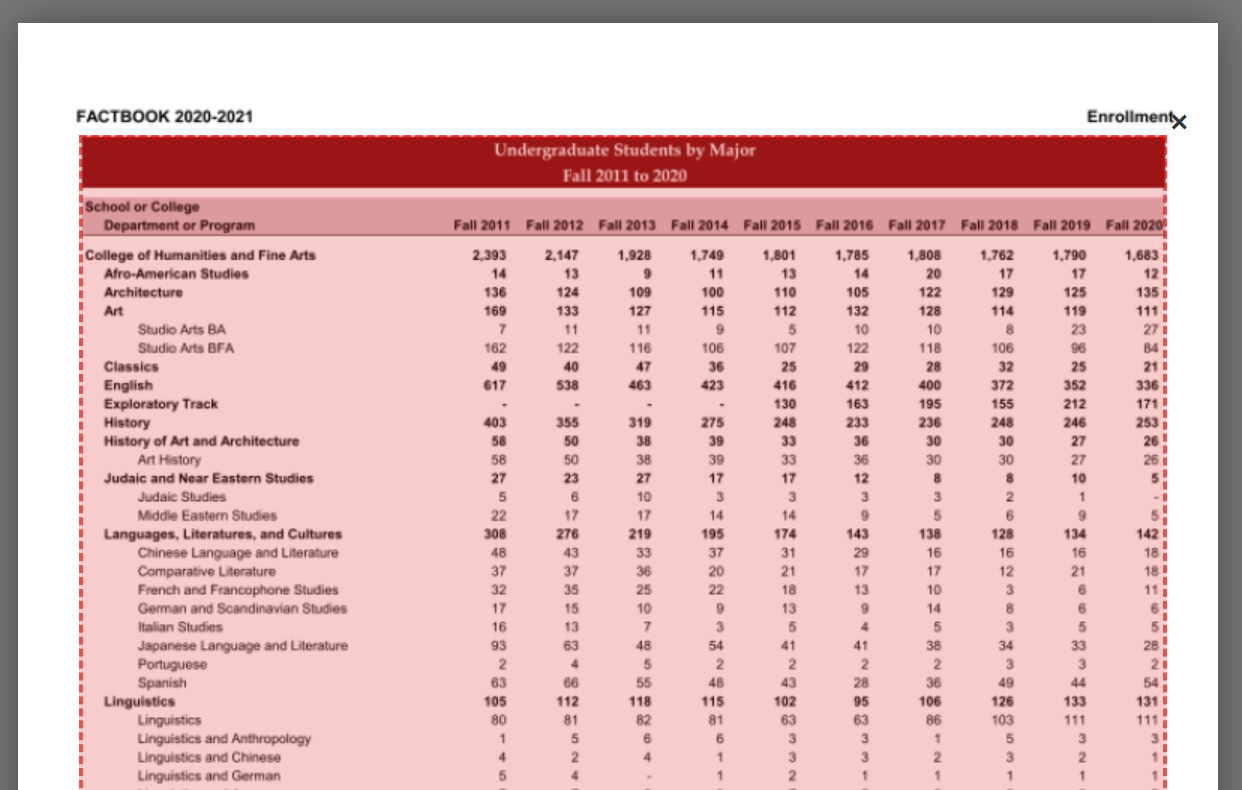
That red box indicates the information that Tabula will try to extract out — that is, the data that are of interest to us. Sometimes, the autodetect function will do a perfect job guessing what’s relevant to us, and draws boxes around only what we need. Other times, it won’t do a very good job at all and either select irrelevant information (like page numbers) or miss out on relevant data.
When it doesn’t work, you can just click the Clear All Selections button. Or, if you just want to clear one selection (e.g., on a single page), click the X on the top-right hand corner of that red box.
You can also draw your own boxes by simply clicking and dragging to create a box around the data you want:
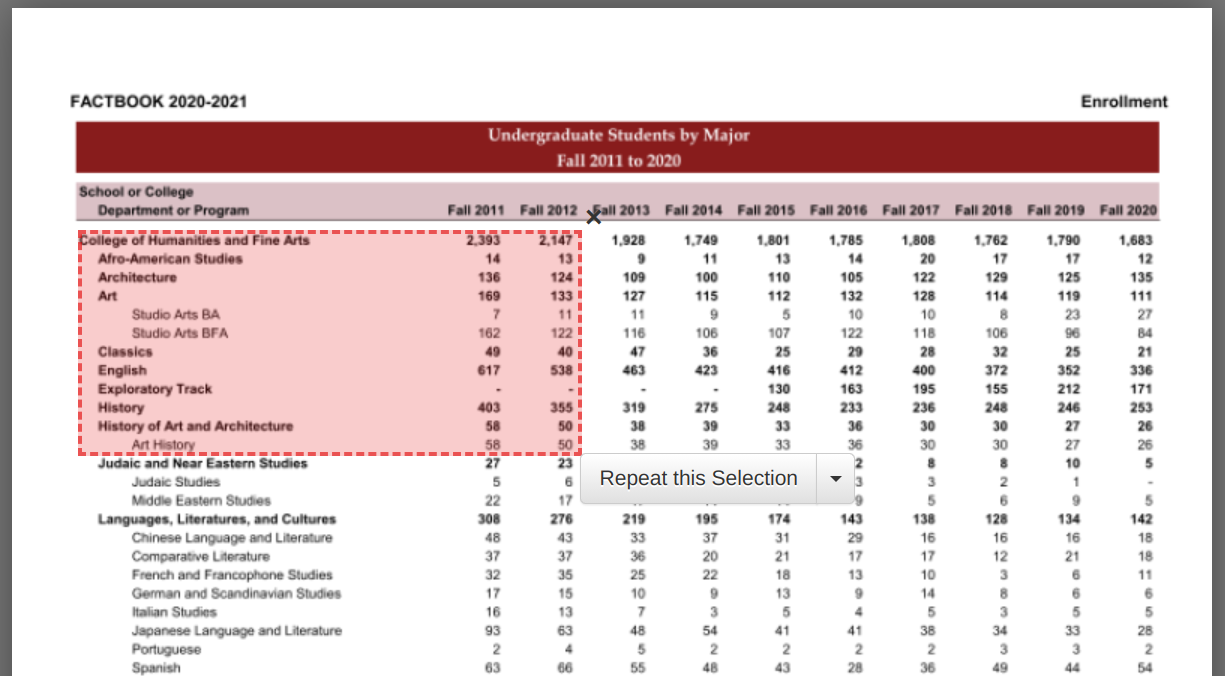
You can draw as many boxes as you want (e.g., you want multiple segments of data). Do note that each box you create only covers the region of the given page. Sometimes, relevant data will appear in the same part of every page, and we can just click the Repeat this Selection box that appears next to the box after we highlight it. It will apply your selection to every page of the PDF document.
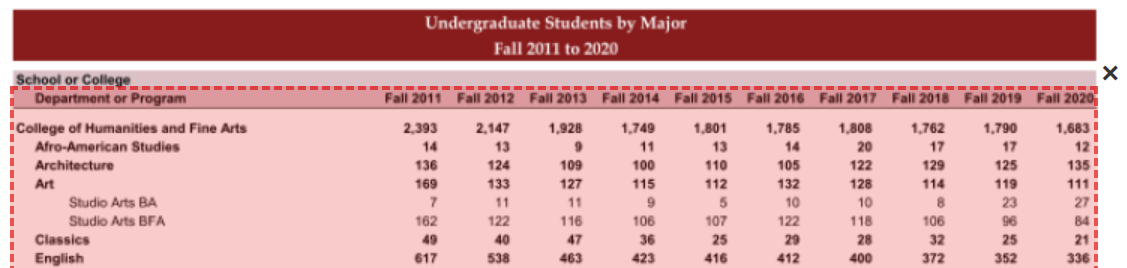
Let’s clear that selection and select Autodetect Tables again, since it worked well with this document. Even though it did a good job guessing the boundaries for the relevant data, we’ll want to make a small adjustments to each page. Specifically, we’ll want to drag down the top edge of the box so that it goes just above the “Department or Program” heading.
The first reason for that is because the information in the maroon box (“Undergraduate Students by Major”) isn’t data; it’s just contextual information for us. Additionally, we’ll leave out the “School or College” piece because there are no columns immediately to the right of it. Instead, the “Fall 2009”, etc., information is only immediately adjacent in the line below. The goal with a CSV file is to have our header information in the first row, so we’ll try to select that at the very top.
The second reason is that our selection (box) has huge implications for how well Tabula is able to guess what goes where with our data. Specifically, if we go as high as “School or College”, Tabula will get confused about the spacing between columns, and possibly combine information about “Fall 2009” and “Fall 2010” into the same cell (e.g., treat them as a single column). It’s usually helpful to get as close as you can to a perfect matrix.
We’ll drag our selection box down to “Department or Program” for each of the three pages on the PDF. (Be careful not to select Repeat this Selection here because the table on the third page is shorter and includes irrelevant information just below it.)
Here’s what it should look like for you (on all three pages):
Previewing the Extraction
Once you’ve done that (again, for all three pages), click the green Preview & Export Extracted Data button.
You should get a screen that looks like this:
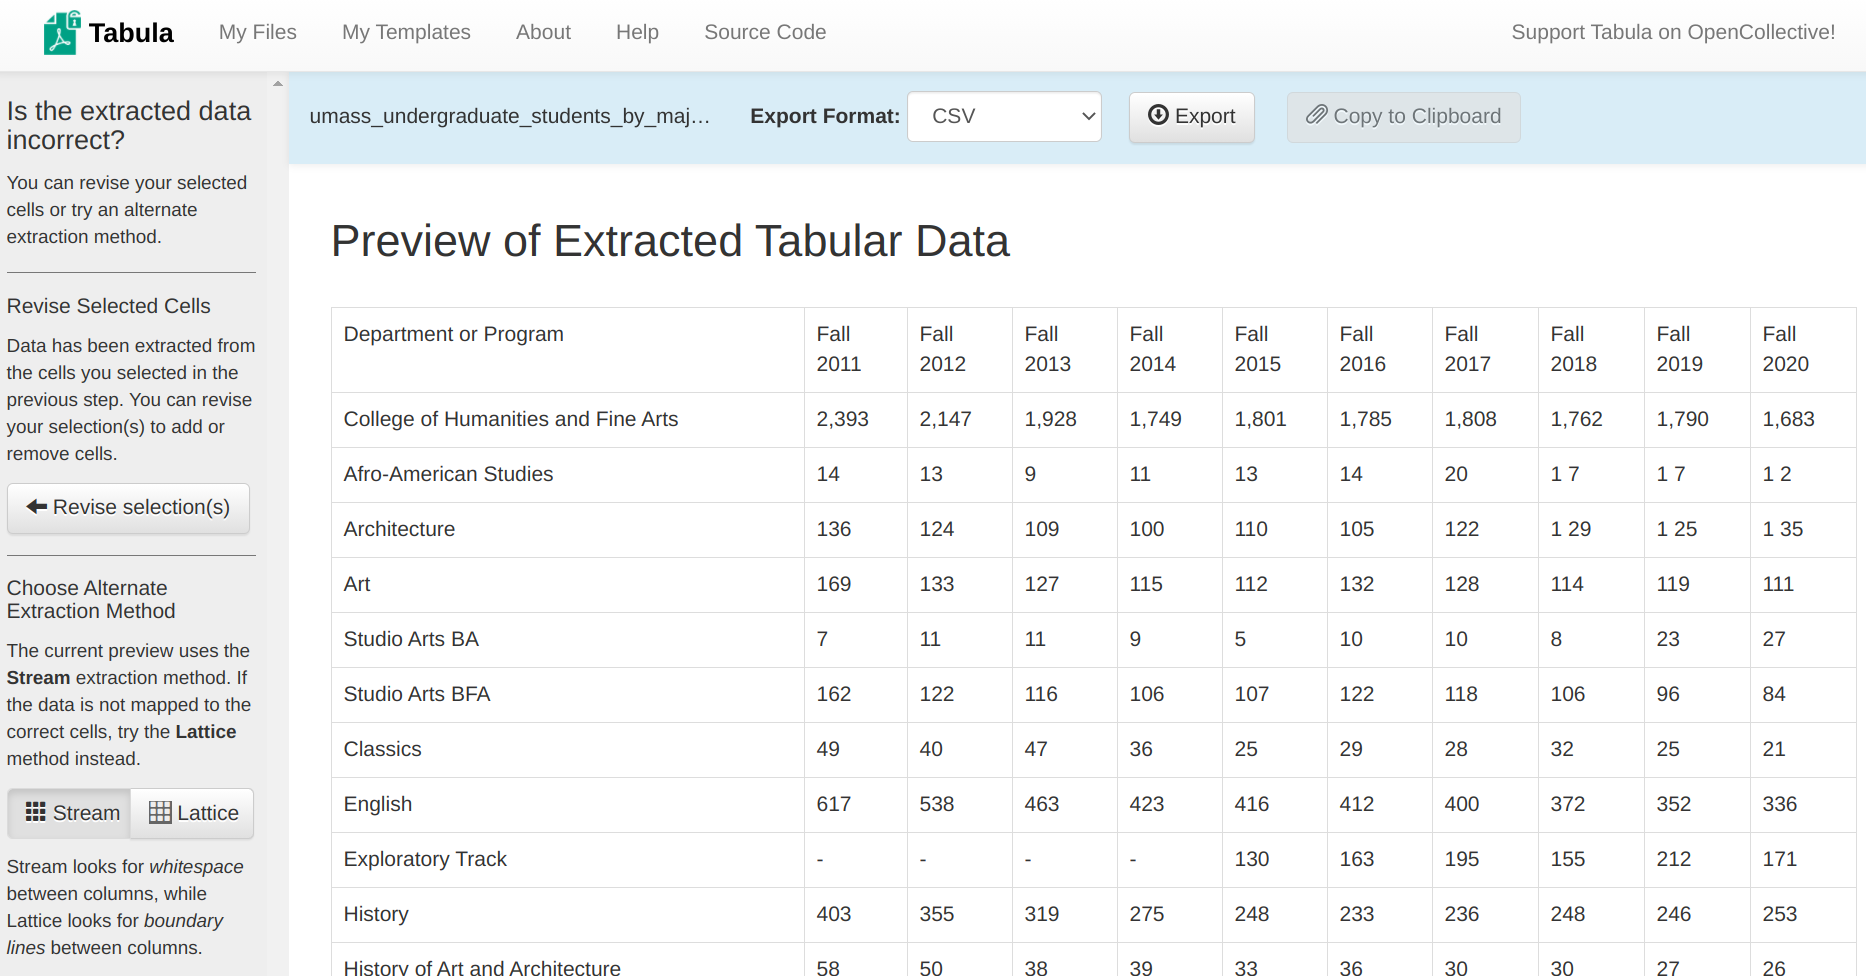
Just as we’d hoped, our first row contains the heading information we were looking for. You’ll notice on the left-hand bar that there are two extraction methods. The first, Stream, looks for white space between values to denote columns. The second, Lattice, looks for boundary lines to denote columns (e.g., table borders). Because the table in our PDF document didn’t have any boundary lines, it’s best to stick with Stream. Other documents may perform better with Lattice.
The second thing we’ll want to check is that our columns align across pages. Tabula will break up each table (page) with some white space in the preview, like so:
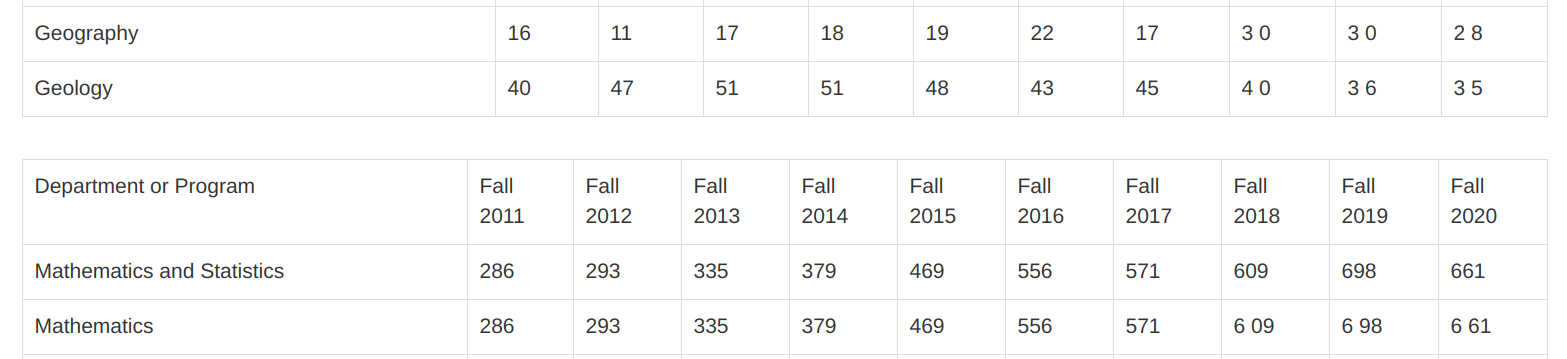
We can see that both Page 1 and Page 2 line up well and, most importantly, have the same number of columns. (The same is the case between Page 2 and Page 3.)
If you’re not happy with the way Tabula extracted the data — or, if your results don’t look the same as the above screenshot — try playing around with those selection margins. Just a few pixels can make a huge difference.
Exporting the Data
Once you are happy with the way your data were extracted, you’ll want to get it from Tabula onto a structured data file that you can use for analysis. Since we intend to work within R and might do some data cleaning with a spreadsheet software, I strongly suggest using a CSV file.
To export the data as a CSV file, just select CSV as our Export Format and click Export. Tabula will ask us where to save the file and that’s it!
If you wish to inspect my CSV file, here is a copy of it. You can compare it against yours to see if you missed anything.
For good practice, I like to save it in a sub-directory of my Project Directory called data. (For example, this might be in a sub-directory of my Documents folder called data-driven-storytelling/tabula-tutorial/data/. I’d store my R Notebook files in the tabula-tutorial folder.)
However, keep in mind that this table introduces a few challenges that we will have to deal before we can start analyzing the data. For example, there will be header lines in the middle of our dataset (i.e., the row with Department or Program on Page 2) since we extracted data from multiple pages in one shot and used that header to align our columns. Similarly, we have to deal with dollar signs ($) and commas (,) in the numerical values — things that can create problems when importing the data into R. Put another way, this dataset needs some ‘cleaning’ before it can be useful to us.
If you intend to use spreadsheet software to ‘clean’ a dataset and want to skip the intermediary step of saving a CSV file, you can also just copy and paste the table into most spreadsheet software. Since the data are now stored in a tabular format, it tends to copy and paste just fine. However, I generally recommend against this because I like making a copy of my data before I make any persistent changes to it.